Proctor and Gamble 2015 Annual Report Download - page 2
Download and view the complete annual report
Please find page 2 of the 2015 Proctor and Gamble annual report below. You can navigate through the pages in the report by either clicking on the pages listed below, or by using the keyword search tool below to find specific information within the annual report.-
 1
1 -
 2
2 -
 3
3 -
 4
4 -
 5
5 -
 6
6 -
 7
7 -
 8
8 -
 9
9 -
 10
10 -
 11
11 -
 12
12 -
 13
13 -
14
-
15
-
16
-
17
-
18
-
19
-
20
-
21
-
22
-
23
-
24
-
25
-
26
-
27
-
28
-
29
-
30
-
31
-
32
-
33
-
34
-
35
-
36
-
37
-
38
-
39
-
40
-
41
-
42
-
43
-
44
-
45
-
46
-
47
-
48
-
49
-
50
-
51
-
52
-
53
-
54
-
55
-
56
-
57
-
58
-
59
-
60
-
61
-
62
-
63
-
64
-
65
-
66
-
67
-
68
-
69
-
70
-
71
-
72
-
73
-
74
-
75
-
76
-
77
-
78
-
79
-
80
-
81
-
82
-
83
-
84
-
85
-
86
-
87
-
88
 |
 |

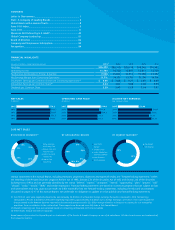
FINANCIAL HIGHLIGHTS
(unaudited)
Amounts in millions, except per share amounts 2015
(1) 2014 2013 2012 2011
Net Sales $76,279 $80,510 $80,116 $79,545 $76,982
Operating Income 11,790 14,740 13,817 12,611 14,779
Net Earnings Attributable to Procter & Gamble 7,036 11,643 11,312 10,756 11,797
Net Earnings Margin from Continuing Operations 11.7% 14.1% 13.7% 11.2% 14.5%
Diluted Net Earnings per Common Share from Continuing Operations (2) $ 3.06 $ 3.86 $ 3.71 $ 2.97 $ 3.69
Diluted Net Earnings per Common Share (2) 2.44 4.01 3.86 3.66 3.93
Dividends per Common Share 2.59 2.45 2.29 2.14 1.97
NET SALES
($ billions)
OPERATING CASH FLOW
($ billions)
DILUTED NET EARNINGS
(per common share)
NET SALES
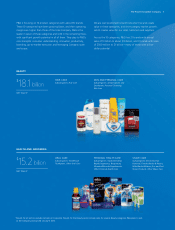
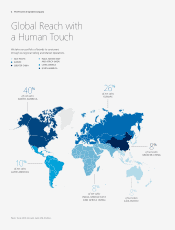
BY BUSINESS SEGMENT() BY GEOGRAPHIC REGION BY MARKET MATURITY
10%
10%
27%
24%
29%
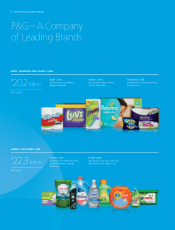
Baby, Feminine
and Family Care
Beauty, Hair and
Personal Care
Fabric Care and
Home Care
Health Care
Grooming
40%
8%
26%
8%
8%
10%
Asia Pacific
Europe
Greater China
India, Middle East
and Africa (IMEA)
Latin America
North America
38%
62%
Developed
Developing
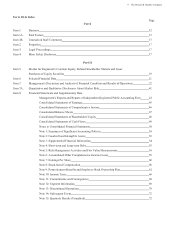
CONTENTS
Letter to Shareowners ................................................................. 1
P&G
—
A Company of Leading Brands .......................................... 6
Global Reach with a Human Touch .............................................. 8
Form 10-K Index .......................................................................... 9
Form 10-K ................................................................................. 11
Measures Not Defined by U.S. GAAP ......................................... 40
Global Company Leadership ...................................................... 81
Board of Directors ..................................................................... 82
Company and Shareowner Information ..................................... 83
Recognition ............................................................................... 84
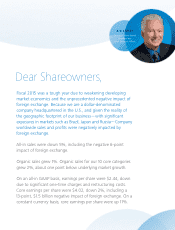
(1) Our 2015 net sales were negatively impacted by approximately $4.8 billion of unfavorable foreign exchange fluctuation compared to 2014. Net earnings
attributable to Procter & Gamble in 2015 were negatively impacted by approximately $1.4 billion due to foreign exchange, $2.1 billion of non-cash impairment
charges related to the Batteries business reported in discontinued operations and a $2.1 billion charge related to a change in accounting for our Venezuelan
operations from consolidation to the cost method. These impacts are discussed more fully later in this Annual Report.
(2) Diluted net earnings per share are calculated based on net earnings attributable to Procter & Gamble.
(3) These results exclude net sales in Corporate.
Brand names referenced in this Annual Report are trademarks of The Procter & Gamble Company or one of its subsidiaries. All other brand names are trademarks of
their respective owners.
Various statements in this Annual Report, including estimates, projections, objectives and expected results, are “forward-looking statements” within
the meaning of the Private Securities Litigation Reform Act of 1995, Section 27A of the Securities Act of 1933 and Section 21E of the Securities
Exchange Act of 1934 and are generally identified by the words “believe,” “expect,” “anticipate,” “intend,” “opportunity,” “plan,” “project,” “will,”
“should,” “could,” “would,” “likely” and similar expressions. Forward-looking statements are based on current assumptions that are subject to risks
and uncertainties that may cause actual results to differ materially from the forward-looking statements, including the risks and uncertainties
discussed on pages 13
–
17 of this Annual Report. We undertake no obligation to update or revise publicly any forward-looking statements.