Proctor and Gamble 2015 Annual Report Download - page 47
Download and view the complete annual report
Please find page 47 of the 2015 Proctor and Gamble annual report below. You can navigate through the pages in the report by either clicking on the pages listed below, or by using the keyword search tool below to find specific information within the annual report.-
 1
1 -
2
-
3
-
4
-
5
-
6
-
7
-
8
-
9
-
10
-
11
-
12
-
13
-
14
-
15
-
16
-
17
-
18
-
19
-
20
-
21
-
22
-
23
-
24
-
25
-
26
-
27
-
28
-
29
-
30
-
31
-
32
-
33
-
34
-
35
-
36
-
 37
37 -
 38
38 -
 39
39 -
 40
40 -
 41
41 -
 42
42 -
 43
43 -
 44
44 -
 45
45 -
 46
46 -
 47
47 -
 48
48 -
 49
49 -
 50
50 -
 51
51 -
 52
52 -
 53
53 -
 54
54 -
 55
55 -
 56
56 -
 57
57 -
58
-
59
-
60
-
61
-
62
-
63
-
64
-
65
-
66
-
67
-
68
-
69
-
70
-
71
-
72
-
73
-
74
-
75
-
76
-
77
-
78
-
79
-
80
-
81
-
82
-
83
-
84
-
85
-
86
-
87
-
88
 |
 |

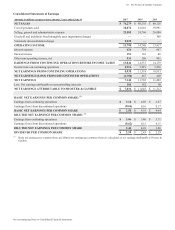
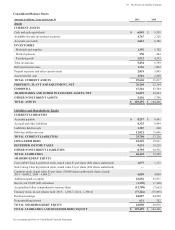
45 The Procter & Gamble Company
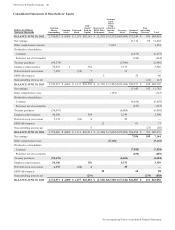
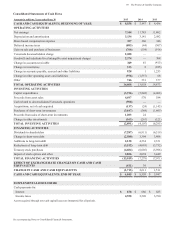
See accompanying Notes to Consolidated Financial Statements.
Consolidated Statements of Earnings
Amounts in millions excet er share amounts Years ended une 0 2015 2014 201
NET SALES ,29 $ 80,510 $ 80,116
Cost of products sold , 41,010 39,991
Selling, general and administrative expense 2,55 24,760 26,000
Goodwill and indefinite-lived intangible asset impairment charges 308
enezuela deconsolidation charge 2,02
OPERATING INCOME 11,90 14,740 13,817
Interest expense 2 710 667
Interest income 151 101 88
Other non-operating income, net 51 206 941
EARNINGS FROM CONTINUING OPERATIONS BEFORE INCOME TAXES 11,4 14,337 14,179
Income taxes on continuing operations 2,91 3,019 3,226
NET EARNINGS FROM CONTINUING OPERATIONS ,90 11,318 10,953
NET EARNINGSLOSS FROM DISCONTINUED OPERATIONS 1,467 449
NET EARNINGS ,144 11,785 11,402
Less: Net earnings attributable to noncontrolling interests 10 142 90
NET EARNINGS ATTRIBUTABLE TO PROCTER & GAMBLE ,0 $ 11,643 $ 11,312
BASIC NET EARNINGS PER COMMON SHARE 1
Earnings from continuing operations .1 $ 4.03 $ 3.87
Earnings(loss) from discontinued operations 0.0.16 0.17
BASIC NET EARNINGS PER COMMON SHARE 2.50 $ 4.19 $ 4.04
DILUTED NET EARNINGS PER COMMON SHARE 1
Earnings from continuing operations .0 $ 3.86 $ 3.71
Earnings(loss) from discontinued operations 0.20.15 0.15
DILUTED NET EARNINGS PER COMMON SHARE 2.44 4.01 3.86
DIVIDENDS PER COMMON SHARE 2.59 $ 2.45 $ 2.29
(1) asic net earnings per common share and diluted net earnings per common share are calculated on net earnings attributable to Procter &
Gamble.