Proctor and Gamble 2015 Annual Report Download - page 32
Download and view the complete annual report
Please find page 32 of the 2015 Proctor and Gamble annual report below. You can navigate through the pages in the report by either clicking on the pages listed below, or by using the keyword search tool below to find specific information within the annual report.-
 1
1 -
2
-
3
-
4
-
5
-
6
-
7
-
8
-
9
-
10
-
11
-
12
-
13
-
14
-
15
-
16
-
17
-
18
-
19
-
20
-
21
-
 22
22 -
 23
23 -
 24
24 -
 25
25 -
 26
26 -
 27
27 -
 28
28 -
 29
29 -
 30
30 -
 31
31 -
 32
32 -
 33
33 -
 34
34 -
 35
35 -
 36
36 -
 37
37 -
 38
38 -
 39
39 -
 40
40 -
 41
41 -
 42
42 -
43
-
44
-
45
-
46
-
47
-
48
-
49
-
50
-
51
-
52
-
53
-
54
-
55
-
56
-
57
-
58
-
59
-
60
-
61
-
62
-
63
-
64
-
65
-
66
-
67
-
68
-
69
-
70
-
71
-
72
-
73
-
74
-
75
-
76
-
77
-
78
-
79
-
80
-
81
-
82
-
83
-
84
-
85
-
86
-
87
-
88
 |
 |
The Procter & Gamble Company 30
System for Foreign Exchange Administration) is an auction-
based exchange program applicable to foreign investment
transactions and certain other qualifying imports of finished
goods and materials. The rate available through SICAD was
10.6 EF per dollar at June 30, 2014 and 12.8 EF per dollar
at June 30, 2015. A third exchange mechanism, referred to as
SIMADI (Sistema Marginal de Divisas), is also an auction-
based program recently trading at approximately 200 EF per
dollar.
Through December 31, 2013, enezuela had only one officially
established exchange rate for qualifying dividends and
imported goods and services, the CENCOEX rate, previously
CADII (Foreign Exchange Administrative Commission).
Accordingly, through December 31, 2013, our results in
enezuela and all of our net monetary assets were measured
at this exchange rate. On January 24, 2014, a number of
announcements were made affecting currency exchange rate
and other controls, including the introduction of the SICAD
and SICAD II exchange rate mechanisms. In addition, based
on local regulatory guidance, we had expected dividends to be
executed under the SICAD rate. Accordingly, beginning in
January 2014, other than transactions flowing through
CENCOEX, our historical operations and balance sheet
positions were generally measured using the SICAD rate. In
January 2015, additional announcements were made relating
to currency exchange rate and other controls, including the
elimination of the SICAD II exchange rate and the introduction
of the SIMADI rate.
A significant portion of our imports have historically qualified
for the CENCOEX rate. hile we continue to import certain
materials and products under this rate, payments for such
qualifying imports have declined in recent years. At this time,
there is considerable uncertainty as to how CENCOEX will
operate in the future, including the nature and quantity of
transactions that will continue to flow through CENCOEX.
However, we believe a portion of our imports will continue to
qualify for the preferential rate. e have had no recent access
to the SICAD market for imports or dividends. To date, we
have had limited access to the SIMADI market. Our plans and
ability to access that market in the future is unclear.
SEGMENT RESULTS
Segment results reflect information on the same basis we use for internal management reporting and performance evaluation. The
results of these reportable segments do not include certain non-business unit specific costs such as interest expense, investing
activities and certain restructuring and asset impairment costs. These costs are reported in our Corporate segment and are included
as part of our Corporate segment discussion. Additionally, as described in Note 12 to the Consolidated Financial Statements, we
apply blended statutory tax rates in the segments. Eliminations to adjust segment results to arrive at our effective tax rate are
included in Corporate. All references to net earnings throughout the discussion of segment results refer to net earnings from
continuing operations.
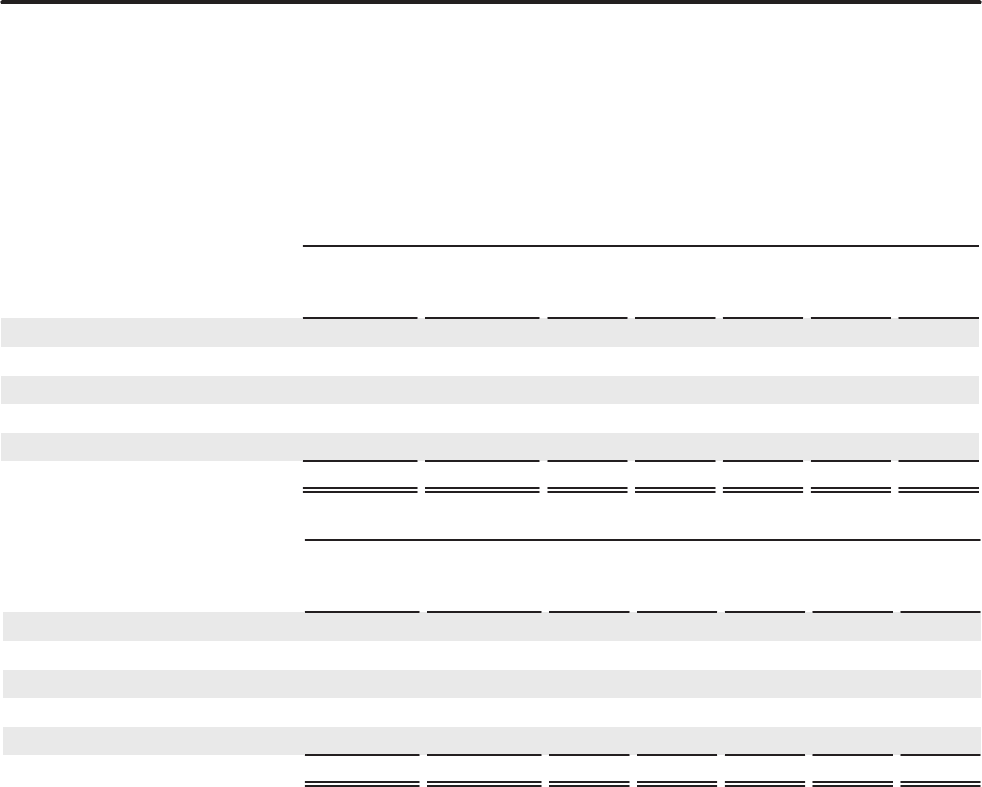
Net Sales Change Driers 2015 s. 2014
Volume with
Acuisitions &
Diestitures
Volume
Excluding
Acuisitions &
Diestitures
Foreign
Exchange Price Mix Other
Net Sales
Growth
eauty, Hair and Personal Care (4 ) (3 ) (5 ) 2 0 0 (7 )
Grooming (3 ) (3 ) (8 ) 4 0 0 (7 )
Health Care (1 ) (1 ) (5 ) 2 3 0 (1 )
Fabric Care and Home Care 1 1 (6 ) 1 0 (1) (5 )
aby, Feminine and Family Care (1 ) (1 ) (6 ) 2 2 0 (3 )
TOTAL COMPANY 1 1 2 0 0 5
Net Sales Change Driers 2014 s. 201
Volume with
Acuisitions &
Diestitures
Volume
Excluding
Acuisitions &
Diestitures
Foreign
Exchange Price Mix Other
Net Sales
Growth
eauty, Hair and Personal Care 0 0 (2) 0 0 0 (2)
Grooming 1 1 (3) 4 (2) 0 0
Health Care 2 2 (1) 1 (1) 0 1
Fabric Care and Home Care 4 5 (3) (1) 0 0 0
aby, Feminine and Family Care 4 3 (3) 1 0 0 2
TOTAL COMPANY 3 3 (3) 1 (1) 0 0
Net sales percentage changes are approximations based on quantitative formulas that are consistently applied. Other includes the sales mix
impact from acquisitions and divestitures and rounding impacts necessary to reconcile volume to net sales.