Proctor and Gamble 2015 Annual Report Download - page 3
Download and view the complete annual report
Please find page 3 of the 2015 Proctor and Gamble annual report below. You can navigate through the pages in the report by either clicking on the pages listed below, or by using the keyword search tool below to find specific information within the annual report.-
 1
1 -
 2
2 -
 3
3 -
 4
4 -
 5
5 -
 6
6 -
 7
7 -
 8
8 -
 9
9 -
 10
10 -
 11
11 -
 12
12 -
 13
13 -
 14
14 -
15
-
16
-
17
-
18
-
19
-
20
-
21
-
22
-
23
-
24
-
25
-
26
-
27
-
28
-
29
-
30
-
31
-
32
-
33
-
34
-
35
-
36
-
37
-
38
-
39
-
40
-
41
-
42
-
43
-
44
-
45
-
46
-
47
-
48
-
49
-
50
-
51
-
52
-
53
-
54
-
55
-
56
-
57
-
58
-
59
-
60
-
61
-
62
-
63
-
64
-
65
-
66
-
67
-
68
-
69
-
70
-
71
-
72
-
73
-
74
-
75
-
76
-
77
-
78
-
79
-
80
-
81
-
82
-
83
-
84
-
85
-
86
-
87
-
88
 |
 |

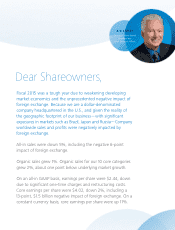
A.G. LAFLEY
Chairman of the Board,
President and
Chief Executive Officer
Dear Shareowners,
Fiscal 2015 was a tough year due to weakening developing
market economics and the unprecedented negative impact of
foreign exchange. Because we are a dollar-denominated
company headquartered in the U.S., and given the reality of
the geographic footprint of our business
—
with significant
exposures in markets such as Brazil, Japan and Russia
—
Company
worldwide sales and profits were negatively impacted by
foreign exchange.
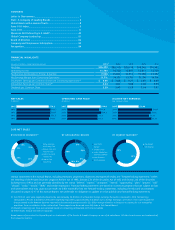
All-in sales were down 5%, including the negative 6-point
impact of foreign exchange.
Organic sales grew 1%. Organic sales for our 10 core categories
grew 2%, about one point below underlying market growth.
On an all-in GAAP basis, earnings per share were $2.44, down
due to significant one-time charges and restructuring costs.
Core earnings per share were $4.02, down 2%, including a
13-point, $1.5 billion negative impact of foreign exchange. On a
constant currency basis, core earnings per share were up 11%.