Proctor and Gamble 2015 Annual Report Download - page 36
Download and view the complete annual report
Please find page 36 of the 2015 Proctor and Gamble annual report below. You can navigate through the pages in the report by either clicking on the pages listed below, or by using the keyword search tool below to find specific information within the annual report.-
 1
1 -
2
-
3
-
4
-
5
-
6
-
7
-
8
-
9
-
10
-
11
-
12
-
13
-
14
-
15
-
16
-
17
-
18
-
19
-
20
-
21
-
22
-
23
-
24
-
25
-
 26
26 -
 27
27 -
 28
28 -
 29
29 -
 30
30 -
 31
31 -
 32
32 -
 33
33 -
 34
34 -
 35
35 -
 36
36 -
 37
37 -
 38
38 -
 39
39 -
 40
40 -
 41
41 -
 42
42 -
 43
43 -
 44
44 -
 45
45 -
 46
46 -
47
-
48
-
49
-
50
-
51
-
52
-
53
-
54
-
55
-
56
-
57
-
58
-
59
-
60
-
61
-
62
-
63
-
64
-
65
-
66
-
67
-
68
-
69
-
70
-
71
-
72
-
73
-
74
-
75
-
76
-
77
-
78
-
79
-
80
-
81
-
82
-
83
-
84
-
85
-
86
-
87
-
88
 |
 |

The Procter & Gamble Company 34
Fiscal year 2014 comparedwithfiscalyear 2013
aby, Feminine and Family Care net sales increased 2 to
$21.0 billion in 2014 on 4 volume growth. Organic sales
were up 4 on 3 organic volume growth. Price increases
primarily in aby Care increased net sales by 1. Unfavorable
foreign exchange reduced net sales by 3. Global market share
of the aby, Feminine and Family Care segment decreased 0.3
points. olume increased low single digits in developed
regions and mid-single digits in developing regions.
olume in aby Care increased mid-single digits due to
a mid-single-digit increase in developing regions, from
market growth and product innovation and a mid-single-
digit increase in developed regions due to the buyout of
our joint venture partner in Iberia and product innovation
in North America, partially offset by competitive activity.
Global market share of the baby care category decreased
slightly.
olume in Feminine Care increased mid-single digits due
to a mid-single-digit increase in developed regions, from
the buyout of our joint venture partner in Iberia and
innovation, and a low single-digit increase in developing
regions from market growth and innovation. Organic
volume was up low single digits. Global market share of
the feminine care category decreased less than half a point.
olume in Family Care increased low single digits due to
product innovation on Charmin and ounty and lower
pricing, partially offset by competitive activity. In the
U.S., all-outlet share of the family care category decreased
less than half point.
Net earnings decreased 4 to $2.9 billion as the increase in
net sales was more than offset by a 90-basis point decrease in
net earnings margin. Net earnings margin decreased primarily
due to gross margin contraction. Gross margin decreased due
to the impact of foreign exchange, higher commodity cost and
unfavorable product and geographic mix from
disproportionate growth in developing regions and mid-tier
products, both of which have lower gross margins than the
segment average, partially offset by manufacturing cost
savings and pricing.
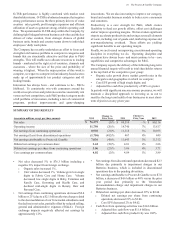
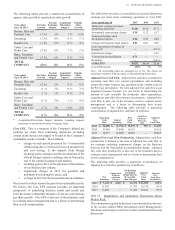
RR
millions 2015
Change
s. 2014 2014
Change
s. 201
Net sales 4 (37) $737 31
Net earnings 2,11 NA $(169) NA
Corporate includes certain operating and non-operating
activities not allocated to specific business units. These
include: the incidental businesses managed at the corporate
level financing and investing activities other general
corporate items the historical gains and losses related to certain
divested brands and categories certain asset impairment
charges certain balance sheet impacts from significant foreign
exchange devaluations and certain restructuring-type
activities to maintain a competitive cost structure, including
manufacturing and workforce optimization. Corporate also
includes reconciling items to adjust the accounting policies
used in the segments to U.S. GAAP. The most significant
reconciling item is income taxes to adjust from blended
statutory tax rates that are reflected in the segments to the
overall Company effective tax rate.
Net sales in Corporate decreased by $271 million in the current
year primarily due to the prior year divestiture of the MDIP
business. Corporate net expenses from continuing operations
increased $2.0 billion in 2015, primarily due the charge related
to the deconsolidation of the enezuelan subsidiaries,
increased foreign exchange transactional charges and
incremental restructuring charges, which were partially offset
by gains on minor brand divestitures.
Net sales in Corporate increased by $173 million in 2014.
Corporate net earnings from continuing operations improved
by $164 million in 2014, primarily due to reduced net after-
tax goodwill and intangible asset impairment charges (which
totaled $290 million in 2013 but were zero in 2014), lower
2014 restructuring and overhead spending and lower overall
Company effective tax rate, partially offset by the holding gain
in 2013 from the buyout of our Iberian joint venture partner.
Additional discussion of the items impacting net earnings in
Corporate are included in the Results of Operations section.
Productiit and Cost Saings Plan
In 2012, the Company initiated a productivity and cost savings
plan to reduce costs and better leverage scale in the areas of
supply chain, research and development, marketing and
overheads. The plan was designed to accelerate cost reductions
by streamlining management decision making, manufacturing
and other work processes to fund the Company's growth
strategy.
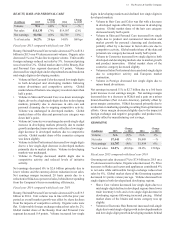
As part of this plan, the Company expects to incur in excess
of $5.0 billion in before-tax restructuring costs over a six-year
period (from fiscal 2012 through fiscal 2017). Approximately
78 of the costs have been incurred through the end of fiscal
2015. Savings generated from the restructuring costs are
difficult to estimate, given the nature of the activities, the
corollary benefits achieved (e.g., enrollment reduction
achieved via normal attrition), the timing of the execution and
the degree of reinvestment. Overall, these costs and other non-
manufacturing enrollment reductions are expected to deliver
approximately $3.0 billion in annual before-tax gross savings.
The cumulative before-tax savings realized through 2015 were
approximately $2.1 billion.
Restructuring accruals of $389 million as of June 30, 2015 are
classified as current liabilities. Approximately 70 of the
restructuring charges incurred during fiscal 2015 either have
been or will be settled with cash. Consistent with our historical
policies for ongoing restructuring-type activities, the resulting
charges are funded by and included within Corporate for
segment reporting.
In addition to our restructuring programs, we have additional
ongoing savings efforts in our supply chain, marketing and
overhead areas that yield additional benefits to our operating
margins.