Proctor and Gamble 2015 Annual Report Download - page 64
Download and view the complete annual report
Please find page 64 of the 2015 Proctor and Gamble annual report below. You can navigate through the pages in the report by either clicking on the pages listed below, or by using the keyword search tool below to find specific information within the annual report.-
 1
1 -
2
-
3
-
4
-
5
-
6
-
7
-
8
-
9
-
10
-
11
-
12
-
13
-
14
-
15
-
16
-
17
-
18
-
19
-
20
-
21
-
22
-
23
-
24
-
25
-
26
-
27
-
28
-
29
-
30
-
31
-
32
-
33
-
34
-
35
-
36
-
37
-
38
-
39
-
40
-
41
-
42
-
43
-
44
-
45
-
46
-
47
-
48
-
49
-
50
-
51
-
52
-
53
-
 54
54 -
 55
55 -
 56
56 -
 57
57 -
 58
58 -
 59
59 -
 60
60 -
 61
61 -
 62
62 -
 63
63 -
 64
64 -
 65
65 -
 66
66 -
 67
67 -
 68
68 -
 69
69 -
 70
70 -
 71
71 -
 72
72 -
 73
73 -
 74
74 -
75
-
76
-
77
-
78
-
79
-
80
-
81
-
82
-
83
-
84
-
85
-
86
-
87
-
88
 |
 |
The Procter & Gamble Company 62
Amounts in millions of dollars except per share amounts or as otherwise specified.
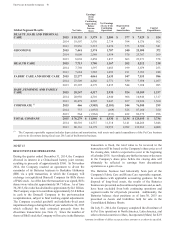
POSTRETIREMENT BENEFITS AND EMPLOYEE
STOCK OWNERSHIP PLAN
e offer various postretirement benefits to our employees.
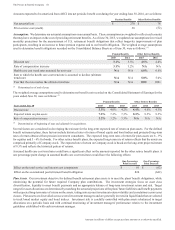
Defined Contriution Retirement Plans
e have defined contribution plans which cover the majority
of our U.S. employees, as well as employees in certain other
countries. These plans are fully funded. e generally make
contributions to participants' accounts based on individual base
salaries and years of service. Total global defined contribution
expense was $305, $311 and $314 in 2015, 2014 and 2013,
respectively.
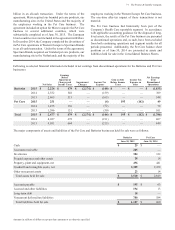
The primary U.S. defined contribution plan (the U.S. DC plan)
comprises the majority of the expense for the Company's
defined contribution plans. For the U.S. DC plan, the
contribution rate is set annually. Total contributions for this
plan approximated 14 of total participants' annual wages and
salaries in 2015 and 15 in 2014 and 2013.
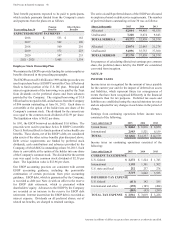
e maintain The Procter & Gamble Profit Sharing Trust
(Trust) and Employee Stock Ownership Plan (ESOP) to
provide a portion of the funding for the U.S. DC plan and other
retiree benefits (described below). Operating details of the
ESOP are provided at the end of this Note. The fair value of
the ESOP Series A shares allocated to participants reduces our
cash contribution required to fund the U.S. DC plan.
Defined Benefit Retirement Plans and Other Retiree
Benefits
e offer defined benefit retirement pension plans to certain
employees. These benefits relate primarily to local plans
outside the U.S. and, to a lesser extent, plans assumed in
previous acquisitions covering U.S. employees.
e also provide certain other retiree benefits, primarily health
care and life insurance, for the majority of our U.S. employees
who become eligible for these benefits when they meet
minimum age and service requirements. Generally, the health
care plans require cost sharing with retirees and pay a stated
percentage of expenses, reduced by deductibles and other
coverages. These benefits are primarily funded by ESOP
Series shares and certain other assets contributed by the
Company.
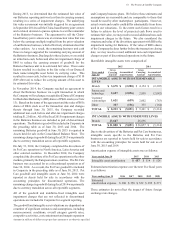
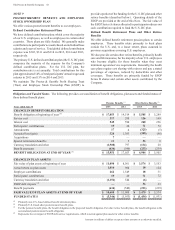
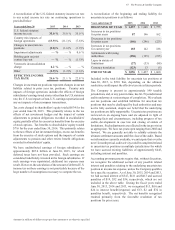
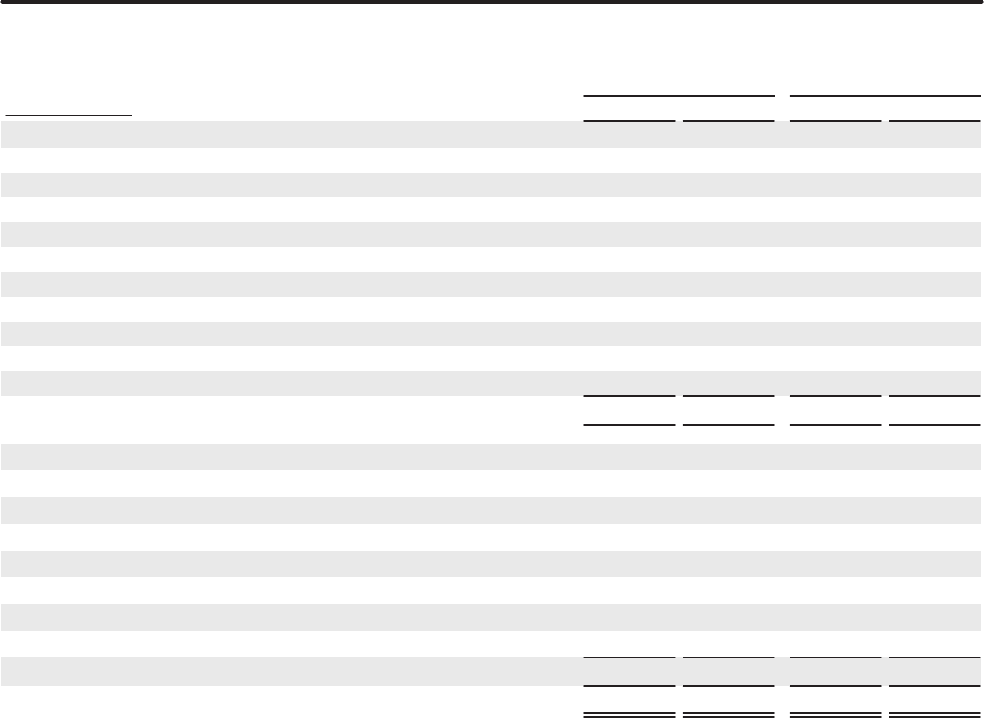
lton n ne ttsThe following provides a reconciliation of benefit obligations, plan assets and funded status of
these defined benefit plans:
Pension Benefits (1) Other Retiree Benefits (2)
Years ended une 0 2015 2014 2015 2014
CHANGE IN BENEFIT OBLIGATION
enefit obligation at beginning of year (3) 1,05 $ 14,514 5,505 $ 5,289
Service cost 1 298 15 149
Interest cost 545 590 240 256
Participants' contributions 19 20 1 72
Amendments 1 425(5)
Actuarial loss(gain) 524 1,365 99(46)
Acquisitions
Special termination benefits 11 52 9
Currency translation and other 1,90797 1420
enefit payments 4(540)2(239)
BENEFIT OBLIGATION AT END OF YEAR (3) 15,951 $ 17,053 4,904 $ 5,505
CHANGE IN PLAN ASSETS
Fair value of plan assets at beginning of year 11,09 $ 8,561 ,54 $ 3,553
Actual return on plan assets 1,01 964 10 124
Employer contributions 22 1,549 1 31
Participants' contributions 19 20 1 72
Currency translation and other 1,15544
ESOP debt impacts (4) 33
enefit payments 4(540)2(239)
FAIR VALUE OF PLAN ASSETS AT END OF YEAR 10,05 $ 11,098 ,40 $ 3,574
FUNDED STATUS 5,4$(5,955)1,44$(1,931)
(1) Primarily non-U.S.-based defined benefit retirement plans.
(2) Primarily U.S.-based other postretirement benefit plans.
(3) For the pension benefit plans, the benefit obligation is the projected benefit obligation. For other retiree benefit plans, the benefit obligation is the
accumulated postretirement benefit obligation.
(4) Represents the net impact of ESOP debt service requirements, which is netted against plan assets for other retiree benefits.