Proctor and Gamble 2015 Annual Report Download - page 37
Download and view the complete annual report
Please find page 37 of the 2015 Proctor and Gamble annual report below. You can navigate through the pages in the report by either clicking on the pages listed below, or by using the keyword search tool below to find specific information within the annual report.-
 1
1 -
2
-
3
-
4
-
5
-
6
-
7
-
8
-
9
-
10
-
11
-
12
-
13
-
14
-
15
-
16
-
17
-
18
-
19
-
20
-
21
-
22
-
23
-
24
-
25
-
26
-
 27
27 -
 28
28 -
 29
29 -
 30
30 -
 31
31 -
 32
32 -
 33
33 -
 34
34 -
 35
35 -
 36
36 -
 37
37 -
 38
38 -
 39
39 -
 40
40 -
 41
41 -
 42
42 -
 43
43 -
 44
44 -
 45
45 -
 46
46 -
 47
47 -
48
-
49
-
50
-
51
-
52
-
53
-
54
-
55
-
56
-
57
-
58
-
59
-
60
-
61
-
62
-
63
-
64
-
65
-
66
-
67
-
68
-
69
-
70
-
71
-
72
-
73
-
74
-
75
-
76
-
77
-
78
-
79
-
80
-
81
-
82
-
83
-
84
-
85
-
86
-
87
-
88
 |
 |
35 The Procter & Gamble Company
Refer to Note 3 to our Consolidated Financial Statements for
more details on the restructuring program and to the Operating
Costs section of this MD&A for more information about the
total benefit to operating margins from our total savings efforts.
CASH FLOW, FINANCIAL CONDITION AND
LIUIDITY
e believe our financial condition continues to be of high
quality, as evidenced by our ability to generate substantial cash
from operations and ready access to capital markets at
competitive rates.
Operating cash flow provides the primary source of cash to
fund operating needs and capital expenditures. Excess
operating cash is used first to fund shareholder dividends.
Other discretionary uses include share repurchases and
acquisitions to complement our portfolio of businesses, brands
and geographies. As necessary, we may supplement operating
cash flow with debt to fund these activities. The overall cash
position of the Company reflects our strong business results
and a global cash management strategy that takes into account
liquidity management, economic factors and tax
considerations.
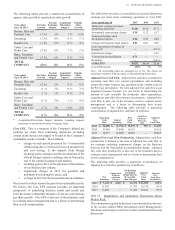
Oerating Cash Flow
Fiscal year 2015 compared with fiscal year 2014
Operating cash flow was $14.6 billion in 2015, a 5 increase
from the prior year. Operating cash flows resulted primarily
from net earnings, adjusted for non-cash items (depreciation
and amortization, stock-based compensation, deferred income
taxes, impairment charges, gains on sale of businesses and the
enezuela deconsolidation charge) and a decrease in working
capital, partially offset by the impact of other operating assets
and liabilities. Reduced accounts receivable generated $349
million of cash due to changes in customer terms and improved
collection results. The number of days sales outstanding
decreased 5 days due to foreign exchange impacts and
improvements in collection results and customer terms. Lower
inventory generated $313 million of cash mainly due to supply
chain optimizations and lower commodity costs. Inventory
days on hand decreased 7 days due to foreign exchange
impacts, supply chain optimizations and lower commodity
costs. Accounts payable, accrued and other liabilities
increased, generating $928 million in operating cash flow
primarily driven by extended payment terms. Other operating
assets and liabilities utilized $976 million of cash primarily to
eliminate the deferred tax impacts associated with the Pet Care
divestiture.
Fiscal year 2014 compared with fiscal year 2013
Operating cash flow was $14.0 billion in 2014, a 6 decrease
from the prior year, which was primarily driven by a $1.0
billion discretionary contribution into a foreign pension plan.
Operating cash flows resulted primarily from net earnings,
adjusted for non-cash items (depreciation and amortization,
stock-based compensation, deferred income taxes and gains
on sale of businesses) partially offset by the impact of other
operating assets and liabilities. orking capital changes did
not have a significant impact on operating cash flow in 2014.
Reduced accounts receivable generated $87 million of cash
primarily due to improved collection results, which, along with
the timing and mix of sales late in the period, drove a 1 day
decrease in accounts receivable days sales outstanding.
Inventory changes did not significantly impact operating cash
flow as inventory management improvement efforts offset
inventory needed to support product initiatives and build stock
to support capacity expansions and manufacturing sourcing
changes. Inventory days on hand decreased by 3 days primarily
due to inventory management improvement efforts. Accounts
payable, accrued and other liabilities also did not significantly
impact operating cash flow. Other operating assets and
liabilities utilized $1.6 billion of cash, primarily driven by $1.0
billion of cash used for a discretionary contribution into a
foreign pension plan.
ste ee s lo e view adjusted free cash flow
as an important measure because it is a factor impacting the
amount of cash available for dividends, share repurchases,
acquisitions and other discretionary investment. It is defined
as operating cash flow less capital expenditures and excluding
certain divestiture impacts (tax payments in the current year
for the Pet Care divestiture) and is one of the measures used
to evaluate senior management and determine their at-risk
compensation.
Fiscal year 2015 compared with fiscal year 2014
Adjusted free cash flow was $11.6 billion in 2015, an increase
of 15 versus the prior year. The increase was driven by the
increase in operating cash flows. Adjusted free cash flow
productivity, defined as the ratio of adjusted free cash flow to
net earnings excluding impairment charges on the atteries
business and the enezuelan deconsolidation charge, was
102 in 2015.
Fiscal year 2014 compared with fiscal year 2013
Adjusted free cash flow was $10.1 billion in 2014, a decrease
of 7 versus the prior year. The decrease was driven by the
decrease in operating cash flows, which was primarily due to
a $1.0 billion discretionary contribution into a foreign pension
plan. Adjusted free cash flow productivity, defined as the ratio
of adjusted free cash flow to net earnings excluding impairment
charges from divested businesses, was 86 in 2014.
Inesting Cash Flow
Fiscal year 2015 compared with fiscal year 2014
Net investing activities consumed $2.9 billion in cash in 2015
mainly due to capital spending, net purchases of available-for-
sale securities and a reduction in cash due to enezuela
deconsolidation, partially offset by asset sales.
Fiscal year 2014 compared with fiscal year 2013
Net investing activities consumed $4.1 billion in cash in 2014
mainly due to capital spending and cash paid for investments
in available-for-sale securities, partially offset by asset sales.
ptl penn e manage capital spending to support our
business growth plans and have cost controls to deliver our
cash generation targets. Capital expenditures, primarily to