Proctor and Gamble 2015 Annual Report Download - page 29
Download and view the complete annual report
Please find page 29 of the 2015 Proctor and Gamble annual report below. You can navigate through the pages in the report by either clicking on the pages listed below, or by using the keyword search tool below to find specific information within the annual report.-
 1
1 -
2
-
3
-
4
-
5
-
6
-
7
-
8
-
9
-
10
-
11
-
12
-
13
-
14
-
15
-
16
-
17
-
18
-
 19
19 -
 20
20 -
 21
21 -
 22
22 -
 23
23 -
 24
24 -
 25
25 -
 26
26 -
 27
27 -
 28
28 -
 29
29 -
 30
30 -
 31
31 -
 32
32 -
 33
33 -
 34
34 -
 35
35 -
 36
36 -
 37
37 -
 38
38 -
 39
39 -
40
-
41
-
42
-
43
-
44
-
45
-
46
-
47
-
48
-
49
-
50
-
51
-
52
-
53
-
54
-
55
-
56
-
57
-
58
-
59
-
60
-
61
-
62
-
63
-
64
-
65
-
66
-
67
-
68
-
69
-
70
-
71
-
72
-
73
-
74
-
75
-
76
-
77
-
78
-
79
-
80
-
81
-
82
-
83
-
84
-
85
-
86
-
87
-
88
 |
 |

27 The Procter & Gamble Company
marketing efficiencies. Overhead costs are also variable in
nature, but on a relative basis, less so than marketing costs due
to our ability to leverage our organization and systems
infrastructures to support business growth. Accordingly, we
generally experience more scale-related impacts for these
costs.
The Company is in the midst of a productivity and cost savings
plan to reduce costs in the areas of supply chain, marketing
and overhead expenses. The plan is designed to accelerate cost
reductions by streamlining management decision making,
manufacturing and other work processes to fund the
Company's growth strategy.
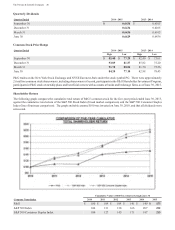
Net Sales
Fiscal year 2015 compared with fiscal year 2014
Net sales decreased 5 to $76.3 billion in 2015 on a 1
decrease in unit volume versus the prior year period. olume
grew low single digits in Fabric Care and Home Care. olume
decreased low single digits in aby, Feminine and Family Care,
Grooming and Health Care and decreased mid-single digits in
eauty, Hair and Personal Care. olume increased low single
digits in developed regions and declined low single digits in
developing regions due, in part, to pricing actions to address
foreign exchange devaluations. Unfavorable foreign exchange
reduced net sales by 6, while higher pricing drove a 2
favorable impact on net sales. Organic volume decreased 1
and organic sales grew 1 driven by higher pricing.
Fiscal year 2014 compared with fiscal year 2013
Net sales increased less than half a percent to $80.5 billion in
2014 on a 3 increase in unit volume versus the prior year
period. Fabric Care and Home Care along with aby, Feminine
and Family Care volume grew mid-single digits. Grooming
and Health Care volume grew low single digits. eauty, Hair
and Personal Care volume was unchanged. olume increased
low single digits in developed regions and grew mid-single
digits in developing regions. Unfavorable foreign exchange
reduced net sales by 3. Organic sales grew 3 driven by the
unit volume increase. A 1 favorable impact from higher
pricing was offset by a 1 impact from unfavorable geographic
and product mix due to higher relative growth of developing
regions, which have lower than average selling prices, and of
lower priced product categories such as Fabric Care and aby
Care.
Oerating Costs
Comarisons as a ercentage of net sales Years ended une 0 2015
Basis Point
Change 2014
Basis Point
Change 201
Gross margin 49.0 (10) 49.1 (100) 50.1
Selling, general and administrative expense 0.9 10 30.8 (170) 32.5
Operating margin 15.5 (280) 18.3 110 17.2
Earnings from continuing operations before income taxes 15.5 (230) 17.8 10 17.7
Net earnings from continuing operations 11. (240) 14.1 40 13.7
Net earnings attributable to Procter & Gamble 9.2 (530) 14.5 40 14.1
Fiscal year 2015 compared with fiscal year 2014
Gross margin decreased 10 basis points to 49.0 of net sales
in 2015. Gross margin benefited from a 200 basis point impact
from manufacturing cost savings and a 90 basis point benefit
from higher pricing. These impacts were offset by a 140 basis
point impact from unfavorable geographic and product mix,
primarily from a decline in the Prestige business, which has
higher than average margins, and within the Fabric Care and
Home Care and Grooming segments. Additional offsets
include a 40 basis point impact from unfavorable foreign
exchange, a 40 basis point impact from costs related to
initiatives and capacity investments, a 30 basis point impact
from higher restructuring costs and smaller impacts from lower
volume scale and higher commodity costs.
Total SG&A decreased 5 to $23.6 billion, as reduced
overhead and marketing spending was partially offset by
increased foreign exchange transaction charges. SG&A as a
percentage of net sales increased 10 basis points to 30.9, as
the negative scale impacts of lower net sales and inflationary
impacts were partially offset by cost savings efforts. Marketing
spending as a percentage of net sales decreased 60 basis points
behind lower spending due to efficiency efforts. Overhead
spending as a percentage of net sales increased 40 basis points
as productivity savings of 60 basis points from reduced
overhead spending were more than offset by wage inflation,
investments in research and development, the negative scale
impacts of lower net sales and higher restructuring costs.
Increased foreign exchange transaction charges added
approximately 30 basis points to SG&A as a percentage of net
sales, as current year foreign currency transaction charges
(from revaluing receivables and payables denominated in a
currency other than a local entitys functional currency) were
partially offset by lower year-on-year charges for enezuela
remeasurement and devaluation.
During fiscal 2015, the Company incurred a $2.0 billion ($2.1
billion after tax) charge related to the deconsolidation of its
enezuelan subsidiaries. See the enezuela Impacts later
in the Results of Operations section.