Proctor and Gamble 2015 Annual Report Download - page 59
Download and view the complete annual report
Please find page 59 of the 2015 Proctor and Gamble annual report below. You can navigate through the pages in the report by either clicking on the pages listed below, or by using the keyword search tool below to find specific information within the annual report.-
 1
1 -
2
-
3
-
4
-
5
-
6
-
7
-
8
-
9
-
10
-
11
-
12
-
13
-
14
-
15
-
16
-
17
-
18
-
19
-
20
-
21
-
22
-
23
-
24
-
25
-
26
-
27
-
28
-
29
-
30
-
31
-
32
-
33
-
34
-
35
-
36
-
37
-
38
-
39
-
40
-
41
-
42
-
43
-
44
-
45
-
46
-
47
-
48
-
 49
49 -
 50
50 -
 51
51 -
 52
52 -
 53
53 -
 54
54 -
 55
55 -
 56
56 -
 57
57 -
 58
58 -
 59
59 -
 60
60 -
 61
61 -
 62
62 -
 63
63 -
 64
64 -
 65
65 -
 66
66 -
 67
67 -
 68
68 -
 69
69 -
70
-
71
-
72
-
73
-
74
-
75
-
76
-
77
-
78
-
79
-
80
-
81
-
82
-
83
-
84
-
85
-
86
-
87
-
88
 |
 |
57 The Procter & Gamble Company
Amounts in millions of dollars except per share amounts or as otherwise specified.
June 30, 2015 and 2014, we did not have any commodity
hedging activity.
Insurance
e self-insure for most insurable risks. However, we purchase
insurance for Directors and Officers Liability and certain other
coverage where it is required by law or by contract.
Fair Value Hierarch
Accounting guidance on fair value measurements for certain
financial assets and liabilities requires that financial assets and
liabilities carried at fair value be classified and disclosed in
one of the following categories:
Level 1: uoted market prices in active markets for
identical assets or liabilities.
Level 2: Observable market-based inputs or unobservable
inputs that are corroborated by market data.
Level 3: Unobservable inputs reflecting the reporting
entity's own assumptions or external inputs from inactive
markets.
hen applying fair value principles in the valuation of assets
and liabilities, we are required to maximize the use of quoted
market prices and minimize the use of unobservable inputs.
The Company has not changed its valuation techniques used
in measuring the fair value of any financial assets or liabilities
during the year. Our fair value estimates take into consideration
the credit risk of both the Company and our counterparties.
hen active market quotes are not available for financial assets
and liabilities, we use industry standard valuation models.
here applicable, these models project future cash flows and
discount the future amounts to a present value using market-
based observable inputs including credit risk, interest rate
curves, foreign currency rates and forward and spot prices for
currencies. In circumstances where market-based observable
inputs are not available, management judgment is used to
develop assumptions to estimate fair value. Generally, the fair
value of our Level 3 instruments is estimated as the net present
value of expected future cash flows based on external inputs.
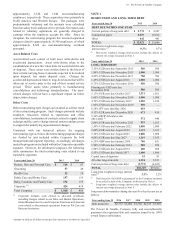
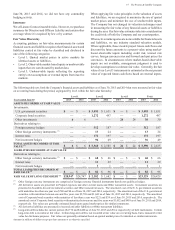
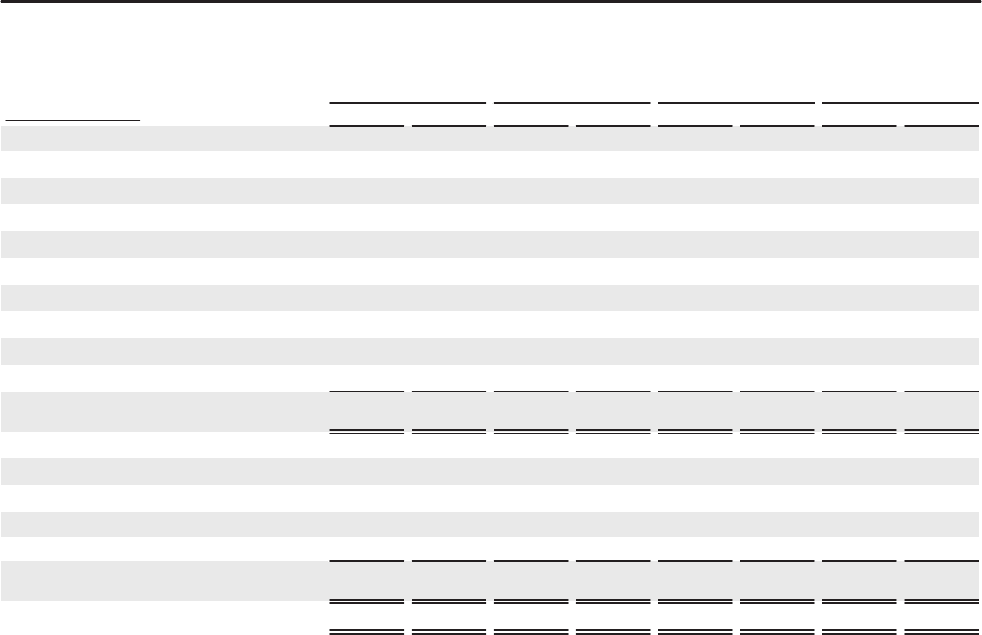
The following table sets forth the Company's financial assets and liabilities as of June 30, 2015 and 2014 that were measured at fair value
on a recurring basis during the period, segregated by level within the fair value hierarchy:
Leel 1 Leel 2 Leel Total
Years ended une 0 2015 2014 2015 2014 2015 2014 2015 2014
ASSETS RECORDED AT FAIR VALUE
Investments:
U.S. government securities
$
,495 $ 1,631
$
,495 $ 1,631
Corporate bond securities 1,22 497 1,22 497
Other investments 624 24 0 30
Derivatives relating to:
Foreign currency hedges 12 187 12 187
Other foreign currency instruments (1) 1 24 1 24
Interest rates 12 197 12 197
Net investment hedges 9 49 9 49
TOTAL ASSETS RECORDED AT FAIR
VALUE 2
$6
5,0 $ 2,585 24 $ 24 5,90 $ 2,615
LIABILITIES RECORDED AT FAIR VALUE
Derivatives relating to:
Other foreign currency instruments (1)
$
$ 66
$
$ 66
Interest rates 1 29 1 29
Net investment hedges 1111
TOTAL LIABILITIES RECORDED AT
FAIR VALUE
$
2 $ 96
$
2 $ 96
FAIR VALUE OF LONG-TERM DEBT 4 20,94 $24,747 2,12 $ 1,682
$
2,129 $26,429
(1) Other foreign currency instruments are comprised of foreign currency financial instruments that do not qualify as hedges.
(2) All derivative assets are presented in Prepaid expenses and other current assets and Other noncurrent assets. Investment securities are
presented in Available-for-sale investment securities and Other noncurrent assets. The amortized cost of the U.S. government securities
with maturities less than one year was $700 and $0 as of June 30, 2015 and 2014, respectively. The amortized cost of the U.S. government
securities with maturities between one and five years was $2,789 and $1,649 as of June 30, 2015 and 2014, respectively. The amortized
cost of Corporate bond securities with maturities of less than a year was $221 and $39 as of June 30, 2015 and 2014, respectively. The
amortized cost of Corporate bond securities with maturities between one and five years was $1,052 and $458 as of June 30, 2015 and 2014,
respectively. Fair values are generally estimated based upon quoted market prices for similar instruments.
(3) All derivative liabilities are presented in Accrued and other liabilities or Other noncurrent liabilities.
(4) Long-term debt includes the current portion ($2,776 and $4,400 as of June 30, 2015 and 2014, respectively) of debt instruments. Certain
long-term debt is recorded at fair value. Certain long-term debt is not recorded at fair value on a recurring basis, but is measured at fair
value for disclosure purposes. Fair values are generally estimated based on quoted market prices for identical or similar instruments.