Proctor and Gamble 2015 Annual Report Download - page 50
Download and view the complete annual report
Please find page 50 of the 2015 Proctor and Gamble annual report below. You can navigate through the pages in the report by either clicking on the pages listed below, or by using the keyword search tool below to find specific information within the annual report.-
 1
1 -
2
-
3
-
4
-
5
-
6
-
7
-
8
-
9
-
10
-
11
-
12
-
13
-
14
-
15
-
16
-
17
-
18
-
19
-
20
-
21
-
22
-
23
-
24
-
25
-
26
-
27
-
28
-
29
-
30
-
31
-
32
-
33
-
34
-
35
-
36
-
37
-
38
-
39
-
 40
40 -
 41
41 -
 42
42 -
 43
43 -
 44
44 -
 45
45 -
 46
46 -
 47
47 -
 48
48 -
 49
49 -
 50
50 -
 51
51 -
 52
52 -
 53
53 -
 54
54 -
 55
55 -
 56
56 -
 57
57 -
 58
58 -
 59
59 -
 60
60 -
61
-
62
-
63
-
64
-
65
-
66
-
67
-
68
-
69
-
70
-
71
-
72
-
73
-
74
-
75
-
76
-
77
-
78
-
79
-
80
-
81
-
82
-
83
-
84
-
85
-
86
-
87
-
88
 |
 |

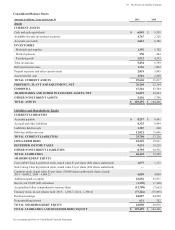
The Procter & Gamble Company 48
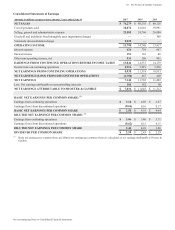
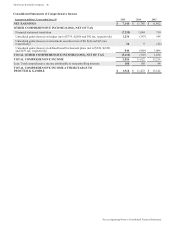
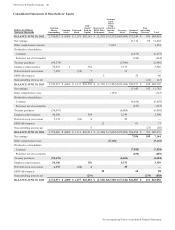
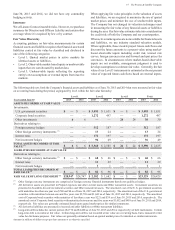
See accompanying Notes to Consolidated Financial Statements.
Consolidated Statements of Shareholders Euit
Dollars in millions
Shares in thousands
Common
Shares
Outstanding
Common
Stock
Preferred
Stock
Add-
itional
Paid-In
Caital
Resere for
ESOP Det
Retirement
Accumu-
lated
Other
Com-
rehensie
Income
Loss
Treasur
Stock
Retained
Earnings
Non-
controlling
Interest Total
BALANCE UNE 0, 2012 2,748,033 $ 4,008 $ 1,195 $63,181 $ (1,357) $ (9,333) $(69,604) $75,349 $ 596 $64,035
Net earnings 11,312 90 11,402
Other comprehensive income 1,834 1,834
Dividends to shareholders:
Common (6,275) (6,275)
Preferred, net of tax benefits (244) (244)
Treasury purchases (84,234) (5,986) (5,986)
Employee plan issuances 70,923 1 352 3,573 3,926
Preferred stock conversions 7,605 (58) 7 51
ESOP debt impacts 555 60
Noncontrolling interest, net (2) (41) (43)
BALANCE UNE 0, 201 2,742,327 $ 4,009 $ 1,137 $63,538 $ (1,352) $ (7,499) $(71,966) $80,197 $ 645 $68,709
Net earnings 11,643 142 11,785
Other comprehensive loss (163) (163)
Dividends to shareholders:
Common (6,658) (6,658)
Preferred, net of tax benefits (253) (253)
Treasury purchases (74,987) (6,005) (6,005)
Employee plan issuances 40,288 364 2,144 2,508
Preferred stock conversions 3,178 (26) 4 22
ESOP debt impacts 12 61 73
Noncontrolling interest, net 5 (25) (20)
BALANCE UNE 0, 2014 2,710,806 $ 4,009 $ 1,111 $63,911 $ (1,340) $ (7,662) $(75,805) $84,990 $ 762 $69,976
Net earnings ,0 10 ,144
Other comprehensive loss 5,11 5,11
Dividends to shareholders:
Common ,02 ,02
Preferred, net of tax benefits 259 259
Treasury purchases 54,0 4,04 4,04
Employee plan issuances 54,100 15 ,15 ,09
Preferred stock conversions 4,5 4 4 0
ESOP debt impacts 20
Noncontrolling interest, net 219 29 45
BALANCE UNE 0, 2015 2,14,51 4,009 1,0 ,52 1,20 12,0 ,22 4,0 1 ,050