Safeway 2000 Annual Report Download - page 13
Download and view the complete annual report
Please find page 13 of the 2000 Safeway annual report below. You can navigate through the pages in the report by either clicking on the pages listed below, or by using the keyword search tool below to find specific information within the annual report.-
 1
1 -
2
-
 3
3 -
 4
4 -
 5
5 -
 6
6 -
 7
7 -
 8
8 -
 9
9 -
 10
10 -
 11
11 -
 12
12 -
 13
13 -
 14
14 -
 15
15 -
 16
16 -
 17
17 -
 18
18 -
 19
19 -
 20
20 -
 21
21 -
 22
22 -
 23
23 -
24
-
25
-
26
-
27
-
28
-
29
-
30
-
31
-
32
-
33
-
34
-
35
-
36
-
37
-
38
-
39
-
40
-
41
-
42
-
43
-
44
-
45
-
46
-
47
-
48
-
49
-
50
 |
 |
11
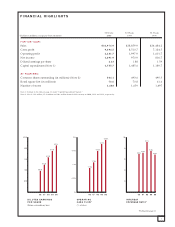
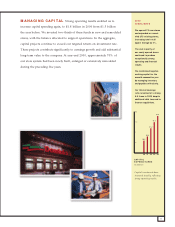
MANAGING CAPITAL Strong operating results enabled us to
increase capital spending again, to $1.8 billion in 2000 from $1.5 billion
the year before. We invested two-thirds of these funds in new and remodeled
stores, with the balance allocated to support operations. In the aggregate,
capital projects continue to exceed our targeted return-on-investment rate.
These projects contribute significantly to earnings growth and add substantial
long-term value to the company. At year-end 2000, approximately 70% of
our store system had been newly built, enlarged or extensively remodeled
during the preceding five years.
2000
HIGHLIGHTS
We opened 75 new stores
and expanded or remod-
eled 275 existing stores,
increasing total retail
square footage by 4% .
The vast majority of
our newly opened stores
continued to produce
exceptionally strong
operating and financial
results.
We maintained negative
working capital for the
seventh consecutive year
by managing inventory
and payables effectively.
Our interest coverage
ratio remained at a strong
6.8 times in 2000 despite
additional debt incurred to
finance acquisitions.
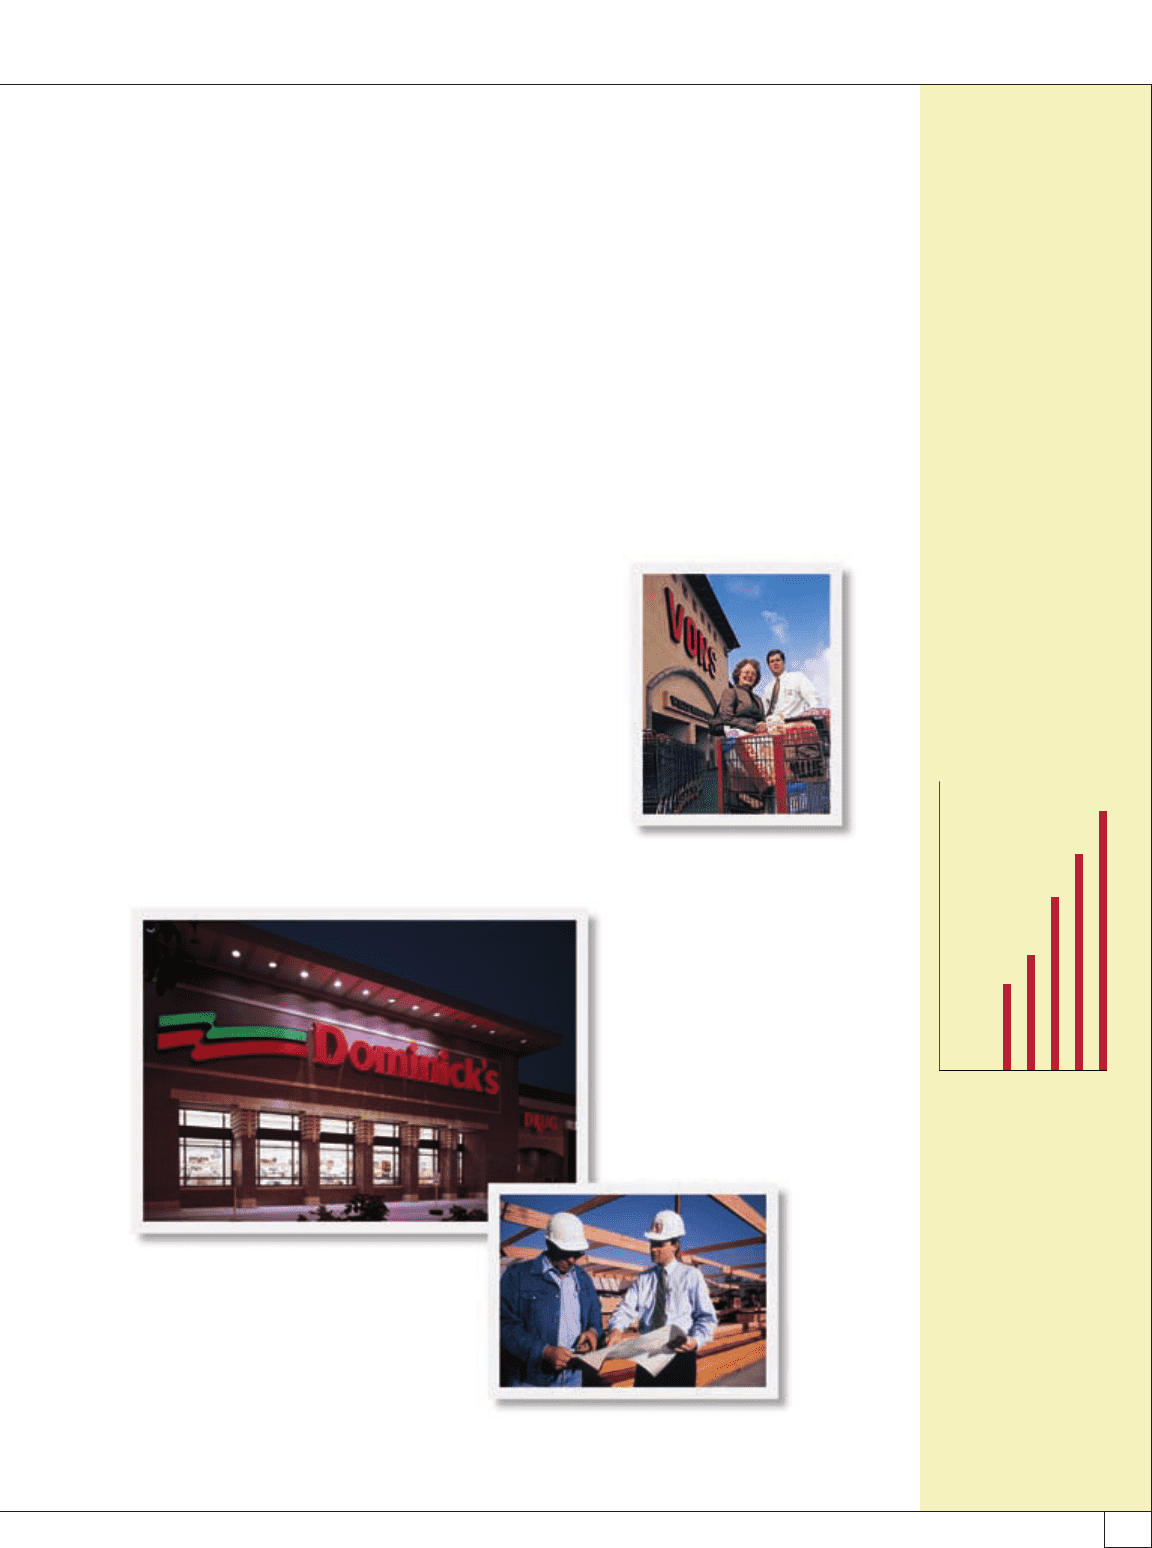
CAPITAL
EXPENDITURES
(In billions)
96 97 98 99 00
$0.6
$0.8
$1.2
$1.5
$1.8
–1
–.5
–1.5
–$2
Capital investments have
increased steadily, reflecting
strong operating results.