Safeway 2000 Annual Report Download - page 18
Download and view the complete annual report
Please find page 18 of the 2000 Safeway annual report below. You can navigate through the pages in the report by either clicking on the pages listed below, or by using the keyword search tool below to find specific information within the annual report.-
 1
1 -
2
-
3
-
4
-
5
-
6
-
7
-
 8
8 -
 9
9 -
 10
10 -
 11
11 -
 12
12 -
 13
13 -
 14
14 -
 15
15 -
 16
16 -
 17
17 -
 18
18 -
 19
19 -
 20
20 -
 21
21 -
 22
22 -
 23
23 -
 24
24 -
 25
25 -
 26
26 -
 27
27 -
 28
28 -
29
-
30
-
31
-
32
-
33
-
34
-
35
-
36
-
37
-
38
-
39
-
40
-
41
-
42
-
43
-
44
-
45
-
46
-
47
-
48
-
49
-
50
 |
 |

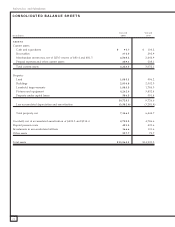
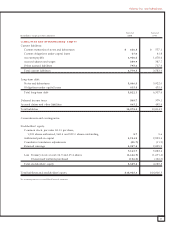
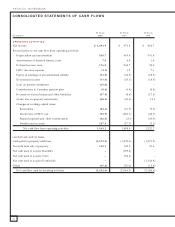
Safeway Inc. and Subsidiaries
16
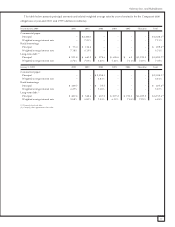
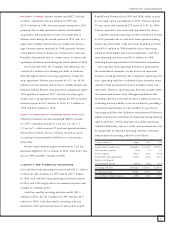
The table below reconciles cash paid for property addi-
tions reflected in the consolidated statements of cash flows
to Safeway’s broader definition of capital expenditures, and
also details changes in the Company’s store base over the last
three years:
(Dollars in millions) 2000 1999 1998
Cash paid for property additions $1,572.5 $1,333.6 $1,075.2
Less: Purchases of previously
leased properties (37.4) (37.2) (35.7)
Plus: Present value of all lease
obligations incurred 201.1 179.5 117.4
Mortgage notes assumed
in property acquisitions 19.5 9.7 32.8
Total capital expenditures $1,755.7 $1,485.6 $1,189.7
Capital expenditures as
a percent of sales 5.5% 5.1% 4.9%
Stores opened (Note 1) 75 67 46
Stores closed or sold 46 54 30
Remodels (Note 2) 275 251 234
Total retail square footage
at year-end (in millions) 73.6 70.8 61.6
Note 1: Excludes acquisitions.
Note 2: Defined as store projects (other than maintenance) generally requiring
expenditures in excess of $200,000.
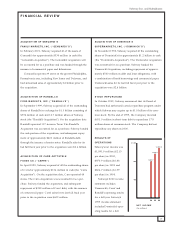
Improved operations and lower project costs have kept the
return on capital projects at a high level, allowing Safeway to
increase capital expenditures to $1.8 billion in 2000 and open
75 stores and remodel 275 stores. In 2001, Safeway expects
to spend more than $2.1 billion and open 90 to 95 new
stores and complete approximately 250 remodels.
PERFORMANCE-BASED COMPENSATION
The Company has performance-based compensation plans
that cover approximately 13,000 management and profes-
sional employees. These plans set overall bonus levels based
upon both operating results and working capital management.
Individual bonuses are based on job performance. Certain
employees are covered by capital investment bonus plans
that measure the performance of capital projects based
on operating performance over several years.
MARKET RISK FROM FINANCIAL INSTRUMENTS
Safeway manages interest rate risk through the strategic use
of fixed and variable interest rate debt and, to a limited
extent, interest rate swaps. As of year-end 2000, the Company
had effectively converted $100 million of its floating-rate
debt to fixed-rate debt through an interest rate swap agree-
ment. Under the swap agreement, Safeway pays interest of
6.2% on a $100 million notional amount and receives a
variable interest rate based on Federal Reserve rates quoted
for commercial paper. This agreement expires in 2007.
The Company does not utilize financial instruments for
trading or other speculative purposes, nor does it utilize
leveraged financial instruments. The Company does not
consider the potential losses in future earnings, fair values
and cash flows from reasonable possible near-term changes
in interest rates and exchange rates to be material.