Safeway 2000 Annual Report Download - page 23
Download and view the complete annual report
Please find page 23 of the 2000 Safeway annual report below. You can navigate through the pages in the report by either clicking on the pages listed below, or by using the keyword search tool below to find specific information within the annual report.-
 1
1 -
2
-
3
-
4
-
5
-
6
-
7
-
8
-
9
-
10
-
11
-
12
-
 13
13 -
 14
14 -
 15
15 -
 16
16 -
 17
17 -
 18
18 -
 19
19 -
 20
20 -
 21
21 -
 22
22 -
 23
23 -
 24
24 -
 25
25 -
 26
26 -
 27
27 -
 28
28 -
 29
29 -
 30
30 -
 31
31 -
 32
32 -
 33
33 -
34
-
35
-
36
-
37
-
38
-
39
-
40
-
41
-
42
-
43
-
44
-
45
-
46
-
47
-
48
-
49
-
50
 |
 |

Safeway Inc. and Subsidiaries
21
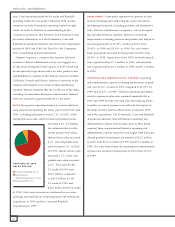
INTEREST EXPENSE Interest expense was $457.2 million
in 2000, compared to $362.2 million in 1999 and
$235.0 million in 1998. Interest expense increased in 2000
primarily due to debt incurred to finance the Randall’s
Acquisition, debt incurred to finance the repurchase of
Safeway stock during the fourth quarter of 1999 and, to a
lesser extent, higher interest rates on variable-rate borrow-
ings. Interest expense increased in 1999 primarily because
of the debt incurred to finance the Dominick’s, Carrs and
Randall’s Acquisitions and, to a lesser extent, to finance the
repurchase of Safeway stock during the fourth quarter of 1999.
As of year-end 2000, the Company had effectively con-
verted $100 million of its floating-rate debt to fixed-rate
debt through an interest rate swap agreement. Under the
swap agreement, Safeway pays interest of 6.2% on a $100
million notional amount and receives a variable interest rate
based on Federal Reserve rates quoted for commercial paper.
This agreement expires in 2007. Interest rate swap agree-
ments, and a cap agreement that expired in 1999, increased
interest expense by $0.2 million in 2000, $1.7 million in
1999 and $2.8 million in 1998.
EQUITY IN EARNINGS OF UNCONSOLIDATED AFFILIATE
Safeway’s investment in unconsolidated affiliate consists
of a 49% ownership interest in Casa Ley, S.A. de C.V.
(“Casa Ley”), which operates 97 food and general merchan-
dise stores in western Mexico. Safeway records its equity
in earnings of unconsolidated affiliate on a one-quarter
delay basis.
Income from Safeway’s equity investment in Casa Ley
decreased slightly to $31.2 million in 2000, from $34.5 mil-
lion in 1999 and $28.5 million in 1998.
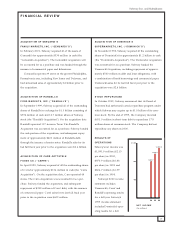
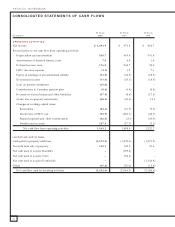
LIQUIDITY AND FINANCIAL RESOURCES
Net cash flow from operating activities was $1,901.1 million
in 2000, $1,488.4 million in 1999 and $1,252.7 million
in 1998. Net cash flow from operating activities increased
in 2000 and 1999 largely due to increased net income and
changes in working capital.
Cash flow used by investing activities was $1,481.0
million in 2000, $2,064.3 million in 1999 and $2,186.4
million in 1998. Cash flow used by investing activities
declined in 2000 primarily because of cash used to acquire
Randall’s and Dominick’s in 1999 and 1998, offset, in part,
by increased capital expenditures in 2000. Safeway opened
75 new stores and remodeled 275 stores in 2000. In 1999,
Safeway opened 67 new stores and remodeled 251 stores.
Cash flow used by financing activities was $434.4 million
in 2000 primarily due to cash flows from operations being
used to pay down debt. Cash flow from financing activities
was $636.0 million in 1999 primarily due to borrowing
related to the Randall’s and Carrs Acquisitions. Cash flow
from financing activities was $903.4 million in 1998,
reflecting borrowing related to the Dominick’s Acquisition.
Net cash flow from operating activities as presented on
the consolidated statement of cash flows is an important
measure of cash generated by the Company’s operating activ-
ities. Operating cash flow, as defined below, is similar to net
cash flow from operations because it excludes certain non-
cash items. However, operating cash flow also excludes inter-
est expense and income taxes. Management believes that
operating cash flow is relevant because it assists investors in
evaluating Safeway’s ability to service its debt by providing a
commonly used measure of cash available to pay interest.
Operating cash flow also facilitates comparisons of Safeway’s
results of operations with those of companies having different
capital structures. Other companies may define operating
cash flow differently, and, as a result, such measures may not
be comparable to Safeway’s operating cash flow. Safeway’s
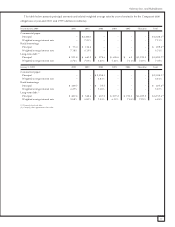
computation of operating cash flow is as follows:
(Dollars in millions) 2000 1999 1998
Income before income taxes $1,866.5 $ 1,674.0 $ 1,396.9
LIFO (income) expense (1.1) 1.2 7.1
Interest expense 457.2 362.2 235.0
Depreciation and amortization 830.7 695.6 531.4
Equity in earnings of
unconsolidated affiliate (31.2) (34.5) (28.5)
Operating cash flow $3,122.1 $ 2,698.5 $ 2,141.9
As a percent of sales 9.76% 9.35% 8.75%
As a multiple of interest expense 6.83x 7.45x 9.11x