Safeway 2000 Annual Report Download - page 38
Download and view the complete annual report
Please find page 38 of the 2000 Safeway annual report below. You can navigate through the pages in the report by either clicking on the pages listed below, or by using the keyword search tool below to find specific information within the annual report.-
 1
1 -
2
-
3
-
4
-
5
-
6
-
7
-
8
-
9
-
10
-
11
-
12
-
13
-
14
-
15
-
16
-
17
-
18
-
19
-
20
-
21
-
22
-
23
-
24
-
25
-
26
-
27
-
 28
28 -
 29
29 -
 30
30 -
 31
31 -
 32
32 -
 33
33 -
 34
34 -
 35
35 -
 36
36 -
 37
37 -
 38
38 -
 39
39 -
 40
40 -
 41
41 -
 42
42 -
 43
43 -
 44
44 -
 45
45 -
 46
46 -
 47
47 -
 48
48 -
49
-
50
 |
 |

Safeway Inc. and Subsidiaries
36
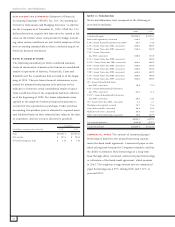
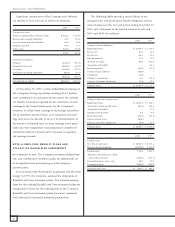
ADDITIONAL STOCK PLAN INFORMATION The Company
accounts for its stock-based awards using the intrinsic value
method in accordance with Accounting Principles Board
Opinion No. 25, “Accounting for Stock Issued to Employees,”
and its related interpretations. Accordingly, no compensation
expense has been recognized in the financial statements for
employee stock option awards granted at fair market value.
SFAS No. 123, “Accounting for Stock-Based Compen-
sation,” requires the disclosure of pro forma net income and
earnings per share as if the Company had adopted the fair value
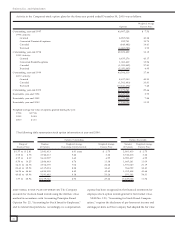
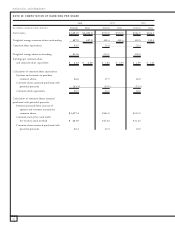
Activity in the Company’s stock option plans for the three-year period ended December 30, 2000 was as follows:
Weighted Average
Options Exercise Price
Outstanding, year-end 1997 40,997,228 $ 7.53
1998 Activity:
Granted 4,987,038 40.28
Converted Dominick’s options 922,701 19.70
Canceled (848,482) 14.61
Exercised (6,680,083) 3.90
Outstanding, year-end 1998 39,378,402 12.15
1999 Activity:
Granted 6,455,276 43.17
Converted Randall’s options 1,069,432 15.54
Canceled (1,325,892) 37.81
Exercised (5,070,905) 4.95
Outstanding, year-end 1999 40,506,313 17.44
2000 Activity:
Granted 8,617,500 43.93
Canceled (1,502,400) 33.81
Exercised (10,441,672) 7.40
Outstanding, year-end 2000 37,179,741 25.66
Exercisable, year-end 1998 24,447,905 5.79
Exercisable, year-end 1999 23,775,488 7.84
Exercisable, year-end 2000 17,239,036 11.52
Weighted average fair value of options granted during the year:
1998 $ 17.06
1999 20.83
2000 21.31
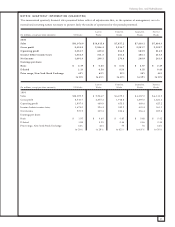
The following table summarizes stock option information at year-end 2000:
Options Outstanding Options Exercisable
Range of Number Weighted-Average Weighted-Average Number Weighted-Average
Exercise Prices of Options Remaining Contractual Life Exercise Price of Options Exercise Price
$ 1.57 to $ 2.81 2,981,413 6.81 years $ 2.75 2,981,413 $ 2.75
3.00 to 4.78 3,742,213 5.42 3.64 3,742,213 3.64
4.99 to 8.32 5,613,597 3.60 6.59 4,789,417 6.55
8.50 to 14.25 2,886,443 4.76 11.38 1,665,261 11.09
14.31 to 26.78 3,516,370 7.06 22.28 1,931,040 21.19
28.63 to 35.94 6,317,824 8.28 33.61 766,022 32.41
36.20 to 48.44 6,830,399 8.42 42.45 1,012,438 41.68
48.63 to 60.94 5,291,482 9.18 53.24 351,232 54.31
1.57 to 60.94 37,179,741 6.93 25.66 17,239,036 11.52