Safeway 2000 Annual Report Download - page 22
Download and view the complete annual report
Please find page 22 of the 2000 Safeway annual report below. You can navigate through the pages in the report by either clicking on the pages listed below, or by using the keyword search tool below to find specific information within the annual report.-
 1
1 -
2
-
3
-
4
-
5
-
6
-
7
-
8
-
9
-
10
-
11
-
 12
12 -
 13
13 -
 14
14 -
 15
15 -
 16
16 -
 17
17 -
 18
18 -
 19
19 -
 20
20 -
 21
21 -
 22
22 -
 23
23 -
 24
24 -
 25
25 -
 26
26 -
 27
27 -
 28
28 -
 29
29 -
 30
30 -
 31
31 -
 32
32 -
33
-
34
-
35
-
36
-
37
-
38
-
39
-
40
-
41
-
42
-
43
-
44
-
45
-
46
-
47
-
48
-
49
-
50
 |
 |

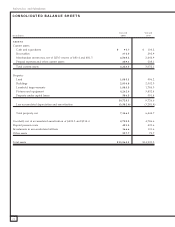
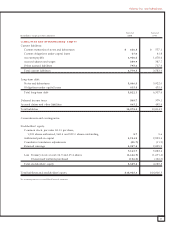
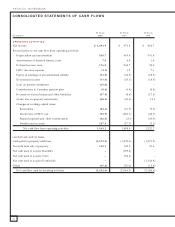
Safeway Inc. and Subsidiaries
20
year, Carrs’ operating results for 40 weeks and Randall’s
operating results for one quarter. Safeway’s 1998 income
statement includes Dominick’s operating results for eight
weeks. In order to facilitate an understanding of the
Company’s operations, this financial review presents certain
pro forma information as if the Dominick’s, Carrs and
Randall’s Acquisitions had been effective for the comparable
periods of 1999 and 1998. See Note B to the Company’s
2000 consolidated financial statements.
Summit Logistics, a company that operates Safeway’s
northern California distribution center, was engaged in a
47-day strike during the fourth quarter of 2000 which had
an unexpectedly large adverse effect on sales, product costs
and distribution expenses at 246 Safeway stores in northern
California, Nevada and Hawaii. Safeway is currently in dis-
cussions with Summit over certain of these distribution
expenses. Safeway estimates that the overall cost of the strike,
including all costs under discussion with Summit, reduced
2000 net income by approximately $0.13 per share.
SALES Strong store operations helped to increase identical-
store sales (stores operating the entire year in both 2000 and
1999, excluding replacement stores) 2.2% in 2000, while
comparable-store sales, which include replacement stores,
increased 2.8%. Excluding
the estimated effects of the
fourth quarter 2000 strike,
identical-store sales increased
2.7% and comparable-store
sales increased 3.3% in 2000.
In 1999, identical-store sales
increased 1.7% while com-
parable-store sales increased
2.2%. Total sales for the
52 weeks of 2000 were
$32.0 billion, compared
to $28.9 billion for the
52 weeks of 1999 and
$24.5 billion for the 52 weeks
of 1998. Total sales increases are attributed to new store
openings, increased sales at continuing stores, the Dominick’s
Acquisition in 1998 and the Carrs and Randall’s
Acquisitions in 1999.
GROSS PROFIT Gross profit represents the portion of sales
revenue remaining after deducting the costs of inventory
sold during the period, including purchase and distribution
costs. Safeway considers store occupancy costs to be operat-
ing and administrative expenses. Safeway’s continuing
improvement in buying practices and product mix helped to
increase gross profit to 29.69% of sales in 2000, from
29.49% in 1999 and 29.10% in 1998. On a pro forma
basis, gross profit increased 40 basis points in 2000 from
29.29% in 1999. Application of the LIFO method reduced
cost of goods sold by $1.1 million in 2000, and increased
cost of goods sold by $1.2 million in 1999 and $7.1 million
in 1998.
OPERATING AND ADMINI STRATIVE EXPENSE Operating
and administrative expense, including amortization of good-
will, was 22.56% of sales in 2000 compared to 22.57% in
1999 and 22.56% in 1998. Safeway’s operating and admin-
istrative expense-to-sales ratio remained essentially flat in
2000 and 1999 because increased sales and ongoing efforts
to reduce or control expenses were offset by the impact of
the strike in 2000 and the effects of the Company’s 1999
and 1998 acquisitions. The Dominick’s, Carrs and Randall’s
Acquisitions adversely affected Safeway’s operating and
administrative expense ratio because, prior to their being
acquired, these companies had historical operating and
administrative expense ratios that were higher than Safeway’s.
Annual goodwill amortization increased to $126.2 million
in 2000 from $101.4 million in 1999 and $56.3 million in
1998. On a pro forma basis, the operating and administrative
expense ratio declined 4 basis points in 2000 from 22.60%
in 1999.
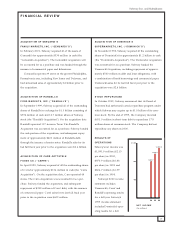
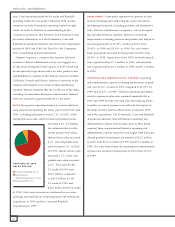
PORTIONS OF 2000
SALES DOLLAR
■ Costs of Goods Sold: 70.3%
■ Operating and
Administrating Expense: 22.6%
■ Operating Profit: 7.1%