Safeway 2000 Annual Report Download - page 44
Download and view the complete annual report
Please find page 44 of the 2000 Safeway annual report below. You can navigate through the pages in the report by either clicking on the pages listed below, or by using the keyword search tool below to find specific information within the annual report.-
 1
1 -
2
-
3
-
4
-
5
-
6
-
7
-
8
-
9
-
10
-
11
-
12
-
13
-
14
-
15
-
16
-
17
-
18
-
19
-
20
-
21
-
22
-
23
-
24
-
25
-
26
-
27
-
28
-
29
-
30
-
31
-
32
-
33
-
 34
34 -
 35
35 -
 36
36 -
 37
37 -
 38
38 -
 39
39 -
 40
40 -
 41
41 -
 42
42 -
 43
43 -
 44
44 -
 45
45 -
 46
46 -
 47
47 -
 48
48 -
 49
49 -
 50
50
 |
 |

Safeway Inc. and Subsidiaries
42
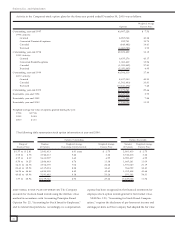
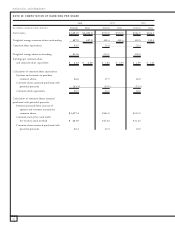
NOTE M: COMPUTATION OF EARNINGS PER SHARE
2000 1999 1998
(In millions, except per-share amounts) Diluted Basic Diluted Basic Diluted Basic
Net income $ 1,091.9 $ 1,091.9 $970.9 $970.9 $806.7 $806.7
Weighted average common shares outstanding 497.9 497.9 498.6 498.6 482.8 482.8
Common share equivalents 13.7 16.8 26.0
Weighted average shares outstanding 511.6 515.4 508.8
Earnings per common share
and common share equivalent: $ 2.13 $ 2.19 $ 1.88 $ 1.95 $ 1.59 $ 1.67
Calculation of common share equivalents:
Options and warrants to purchase
common shares 36.8 37.7 48.0
Common shares assumed purchased with
potential proceeds (23.1) (20.9) (22.0)
Common share equivalents 13.7 16.8 26.0
Calculation of common shares assumed
purchased with potential proceeds:
Potential proceeds from exercise of
options and warrants to purchase
common shares $ 1,077.4 $986.8 $913.9
Common stock price used under
the treasury stock method $ 46.57 $47.26 $ 41.60
Common shares assumed purchased with
potential proceeds 23.1 20.9 22.0