Safeway 2000 Annual Report Download - page 39
Download and view the complete annual report
Please find page 39 of the 2000 Safeway annual report below. You can navigate through the pages in the report by either clicking on the pages listed below, or by using the keyword search tool below to find specific information within the annual report.-
 1
1 -
2
-
3
-
4
-
5
-
6
-
7
-
8
-
9
-
10
-
11
-
12
-
13
-
14
-
15
-
16
-
17
-
18
-
19
-
20
-
21
-
22
-
23
-
24
-
25
-
26
-
27
-
28
-
 29
29 -
 30
30 -
 31
31 -
 32
32 -
 33
33 -
 34
34 -
 35
35 -
 36
36 -
 37
37 -
 38
38 -
 39
39 -
 40
40 -
 41
41 -
 42
42 -
 43
43 -
 44
44 -
 45
45 -
 46
46 -
 47
47 -
 48
48 -
 49
49 -
50
 |
 |

Safeway Inc. and Subsidiaries
37
method as of the beginning of fiscal 1995. Under SFAS
No. 123, the fair value of stock-based awards to employees
is calculated through the use of option pricing models, even
though such models were developed to estimate the fair
value of freely tradable, fully transferable options without
vesting restrictions, which significantly differ from the
Company’s stock option awards. These models also require
subjective assumptions, including future stock price volatility
and expected time to exercise, which greatly affect the
calculated values. The Company’s calculations were made
using the Black-Scholes option pricing model with the
following weighted average assumptions: seven to nine years
expected life; stock volatility of 34% in 2000 and 31% in
1999 and 1998; risk-free interest rates of 6.16% in 2000,
5.79% in 1999 and 5.26% in 1998; and no dividends
during the expected term.
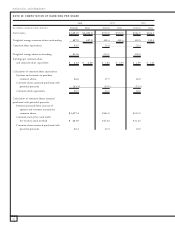
The Company’s calculations are based on a single-option
valuation approach and forfeitures are recognized as they
occur. However, the impact of outstanding unvested stock
options granted prior to 1995 has been excluded from the
pro forma calculation; accordingly, the pro forma results
presented below are not indicative of future period pro
forma results. Had compensation cost for Safeway’s stock
option plans been determined based on the fair value at
the grant date for awards from 1996 through 2000, consistent
with the provisions of SFAS No. 123, the Company’s net
income and earnings per share would have been reduced
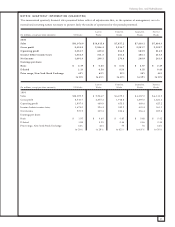
to the pro forma amounts indicated below:
2000 1999 1998
Net income (in millions):
As reported $1,091.9 $ 970.9 $ 806.7
Pro forma 1,061.5 951.5 794.8
Basic earnings per share:
As reported $ 2.19 $ 1.95 $ 1.67
Pro forma 2.13 1.91 1.65
Diluted earnings per share:
As reported $ 2.13 $ 1.88 $ 1.59
Pro forma 2.07 1.85 1.56
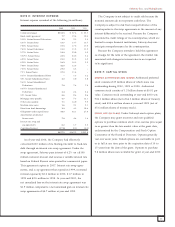
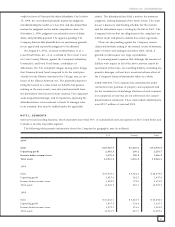
NOTE G: TAXES ON INCOME
The components of income tax expense are as follows (in
millions):
2000 1999 1998
Current:
Federal $ 441.3 $ 333.7 $ 398.8
State 76.4 62.3 80.0
Foreign 80.9 62.4 52.0
598.6 458.4 530.8
Deferred:
Federal 140.5 188.9 44.4
State 30.4 38.1 12.2
Foreign 5.1 17.7 2.8
176.0 244.7 59.4
$ 774.6 $ 703.1 $ 590.2
Tax benefits from the exercise of employee stock options
of $148.9 million in 2000, $77.0 million in 1999 and
$85.2 million in 1998 were credited directly to paid-in capital
and, therefore, are excluded from income tax expense.
The reconciliation of the provision for income taxes at
the U.S. federal statutory income tax rate to the Company’s
income taxes is as follows (dollars in millions):
2000 1999 1998
Statutory rate 35% 35% 35%
Income tax expense using
federal statutory rate $ 653.3 $ 585.9 $488.9
State taxes on income net
of federal benefit 69.4 65.2 59.9
Taxes provided on equity in
earnings of unconsolidated
affiliate at rates below
the statutory rate (7.3) (12.1) (10.0)
Taxes on foreign earnings not
permanently reinvested –8.3 7.9
Nondeductible expenses
and amortization 31.5 32.9 17.6
Difference between statutory rate
and foreign effective rate 20.9 16.6 11.1
Other accruals 6.8 6.3 14.8
$ 774.6 $ 703.1 $590.2