Safeway 2000 Annual Report Download - page 20
Download and view the complete annual report
Please find page 20 of the 2000 Safeway annual report below. You can navigate through the pages in the report by either clicking on the pages listed below, or by using the keyword search tool below to find specific information within the annual report.-
 1
1 -
2
-
3
-
4
-
5
-
6
-
7
-
8
-
9
-
 10
10 -
 11
11 -
 12
12 -
 13
13 -
 14
14 -
 15
15 -
 16
16 -
 17
17 -
 18
18 -
 19
19 -
 20
20 -
 21
21 -
 22
22 -
 23
23 -
 24
24 -
 25
25 -
 26
26 -
 27
27 -
 28
28 -
 29
29 -
 30
30 -
31
-
32
-
33
-
34
-
35
-
36
-
37
-
38
-
39
-
40
-
41
-
42
-
43
-
44
-
45
-
46
-
47
-
48
-
49
-
50
 |
 |

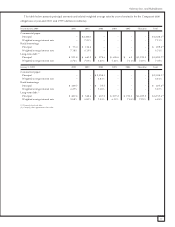
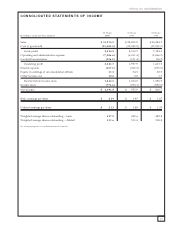
RESULTS OF OPERATIONS
Sales $ 31,976.9 $ 28,859.9 $ 24,484.2 $ 22,483.8 $ 17,269.0
Gross profit 9,494.5 8,510.7 7,124.5 6,414.7 4,774.2
Operating and administrative expense (7,086.6) (6,411.4) (5,466.5) (5,093.2) (3,872.1)
Goodwill amortization (126.2) (101.4) (56.3) (41.8) (10.4)
Operating profit 2,281.7 1,997.9 1,601.7 1,279.7 891.7
Interest expense (457.2) (362.2) (235.0) (241.2) (178.5)
Equity in earnings of
unconsolidated affiliates (Note 1) 31.2 34.5 28.5 34.9 50.0
Other income, net 10.8 3.8 1.7 2.9 4.4
Income before income taxes
and extraordinary loss 1,866.5 1,674.0 1,396.9 1,076.3 767.6
Income taxes (774.6) (703.1) (590.2) (454.8) (307.0)
Income before extraordinary loss 1,091.9 970.9 806.7 621.5 460.6
Extraordinary loss, net of
tax benefit of $41.1 –––(64.1) –
Net income $ 1,091.9 $ 970.9 $ 806.7 $ 557.4 $ 460.6
Diluted earnings per share:
Income before extraordinary loss $ 2.13 $ 1.88 $ 1.59 $ 1.25 $ 0.97
Extraordinary loss –––(0.13) –
Net Income $ 2.13 $ 1.88 $ 1.59 $ 1.12 $ 0.97
FINANCIAL STATISTICS
Comparable-store sales increases (Note 2) 2.8% 2.2% 4.1% 2.3% 5.8%
Identical-store sales increases (Note 2) 2.2% 1.7% 3.7% 1.3% 5.1%
Gross profit margin 29.69% 29.49% 29.10% 28.53% 27.65%
Operating and administrative
expense margin (Note 3) 22.56% 22.57% 22.56% 22.84% 22.48%
Operating profit margin 7.1% 6.9% 6.5% 5.7% 5.2%
Operating cash flow (Note 4) $ 3,122.1 $ 2,698.5 $ 2,141.9 $ 1,732.3 $ 1,239.5
Operating cash flow margin (Note 4) 9.76% 9.35% 8.75% 7.70% 7.18%
Capital expenditures (Note 5) $ 1,755.7 $ 1,485.6 $ 1,189.7 $ 829.4 $ 620.3
Depreciation 704.5 594.2 475.1 414.0 328.1
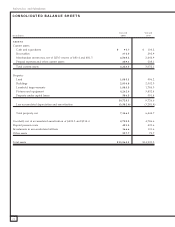
Total assets 15,965.3 14,900.3 11,389.6 8,493.9 5,545.2
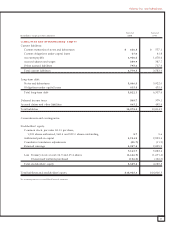
Total debt 6,495.9 6,956.3 4,972.1 3,340.3 1,984.2
Stockholders’ equity 5,389.8 4,085.8 3,082.1 2,149.0 1,186.8
Weighted average shares outstanding –
diluted (in millions) 511.6 515.4 508.8 497.7 475.7
OTHER STATISTICS
Randall’s stores acquired during the year –117 –––
Carrs stores acquired during the year –32 –––
Dominick’s stores acquired during the year ––113 ––
Vons stores acquired during the year –––316 –
Stores opened during the year 75 67 46 37 30
Stores closed or sold during the year 46 54 30 37 37
Total stores at year-end 1,688 1,659 1,497 1,368 1,052
Remodels completed during the year (Note 6) 275 251 234 181 141
Total retail square footage
at year-end (in millions) 73.6 70.8 61.6 53.2 40.7
Note 1. Includes equity in Vons’ earnings through the first quarter of 1997.
Note 2. Defined as stores operating the entire year in both the current year and the previous year. Comparable stores include replacement stores
while identical stores do not. 1997 and 1996 sales increases exclude British Columbia stores, which were closed during a labor dispute in 1996.
2000 sales increases were reduced by an estimated 50 basis points because of the northern California distribution center strike.
Note 3. Includes goodwill amortization.
Note 4: Defined in the table on page 21 under “Liquidity and Financial Resources”.
Note 5. Defined in the table on page 16 under “Capital Expenditure Program”.
Note 6. Defined as store projects (other than maintenance) generally requiring expenditures in excess of $200,000.
Safeway Inc. and Subsidiaries
18
FIVE-YEAR SUMMARY FINANCIAL INFORMATION
52 Weeks 52 Weeks 52 Weeks 53 Weeks 52 Weeks
(Dollars in millions, except per-share amounts) 2000 1999 1998 1997 1996