Safeway 2000 Annual Report Download - page 4
Download and view the complete annual report
Please find page 4 of the 2000 Safeway annual report below. You can navigate through the pages in the report by either clicking on the pages listed below, or by using the keyword search tool below to find specific information within the annual report.-
 1
1 -
 2
2 -
 3
3 -
 4
4 -
 5
5 -
 6
6 -
 7
7 -
 8
8 -
 9
9 -
 10
10 -
 11
11 -
 12
12 -
 13
13 -
 14
14 -
 15
15 -
16
-
17
-
18
-
19
-
20
-
21
-
22
-
23
-
24
-
25
-
26
-
27
-
28
-
29
-
30
-
31
-
32
-
33
-
34
-
35
-
36
-
37
-
38
-
39
-
40
-
41
-
42
-
43
-
44
-
45
-
46
-
47
-
48
-
49
-
50
 |
 |

2
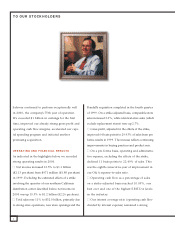
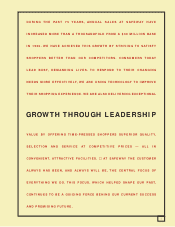
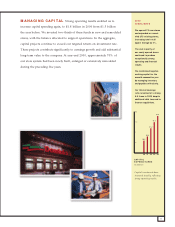
TO OUR STOCKHOLDERS
Safeway continued to perform exceptionally well
in 2000, the company’s 75th year of operation.
We exceeded $1 billion in earnings for the first
time, improved our already strong gross profit and
operating cash flow margins, accelerated our capi-
tal spending program and initiated another
promising acquisition.
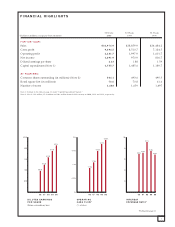
OPERATING AND FINANCIAL RESULTS
As indicated in the highlights below, we recorded
strong operating results in 2000.
■■Net income increased 12.5% to $1.1 billion
($2.13 per share) from $971 million ($1.88 per share)
in 1999. Excluding the estimated effects of a strike
involving the operator of our northern California
distribution center described below, net income in
2000 was up 19.3% to $1.2 billion ($2.26 per share).
■■Total sales rose 11% to $32.0 billion, primarily due
to strong store operations, new store openings and the
Randall’s acquisition completed in the fourth quarter
of 1999. On a strike-adjusted basis, comparable-store
sales increased 3.3%, while identical-store sales (which
exclude replacement stores) were up 2.7%.
■■Gross profit, adjusted for the effects of the strike,
improved 64 basis points to 29.93% of sales from pro
forma results in 1999. The increase reflects continuing
improvements in buying practices and product mix.
■■On a pro forma basis, operating and administra-
tive expense, excluding the effects of the strike,
declined 11 basis points to 22.49% of sales. This
was the eighth consecutive year of improvement in
our O&A expense-to-sales ratio.
■■Operating cash flow as a percentage of sales
on a strike-adjusted basis reached 10.05%, our
best ever and one of the highest EBITDA levels
in the industry.
■■Our interest coverage ratio (operating cash flow
divided by interest expense) remained a strong