Target 2007 Annual Report Download - page 29
Download and view the complete annual report
Please find page 29 of the 2007 Target annual report below. You can navigate through the pages in the report by either clicking on the pages listed below, or by using the keyword search tool below to find specific information within the annual report.-
 1
1 -
2
-
3
-
4
-
5
-
6
-
7
-
8
-
9
-
10
-
11
-
12
-
13
-
14
-
15
-
16
-
17
-
18
-
 19
19 -
 20
20 -
 21
21 -
 22
22 -
 23
23 -
 24
24 -
 25
25 -
 26
26 -
 27
27 -
 28
28 -
 29
29 -
 30
30 -
 31
31 -
 32
32 -
 33
33 -
 34
34 -
 35
35 -
 36
36 -
 37
37 -
 38
38 -
 39
39 -
40
-
41
-
42
-
43
-
44
-
45
-
46
-
47
-
48
-
49
-
50
-
51
-
52
-
53
-
54
-
55
-
56
-
57
-
58
-
59
-
60
-
61
-
62
-
63
-
64
-
65
-
66
-
67
-
68
-
69
-
70
-
71
-
72
-
73
-
74
-
75
-
76
 |
 |

Item 7. Management’s Discussion and Analysis of Financial Condition and Results of
Operations
Executive Summary
Fiscal 2007, a 52 week period, was a year of slower sales and earnings growth for Target than in our
recent past. Net earnings increased 2.2 percent to $2,849 million, and on this same basis, diluted earnings per
share rose 3.9 percent to $3.33. Sales increased 6.2 percent, including comparable-store sales (as defined
below) growth of 3.0 percent. The shorter fiscal year in 2007 adversely impacted sales growth by
1.9 percentage points but had no impact on comparable-store sales growth. The combination of retail and
credit card operations produced earnings before interest expense and income taxes of $5,272 million, an
increase of 4.0 percent from 2006.
Net cash provided by operating activities was $4,125 million for 2007. During 2007 we repurchased
46.2 million shares of our common stock for a total investment of $2,642 million. Additionally, we paid
dividends of $442 million and invested $331 million in call options on our own common stock. We also opened
118 new stores in 2007, or 103 stores net of 14 relocations and one closing.
Management’s Discussion and Analysis is based on our Consolidated Financial Statements in Item 8,
Financial Statements and Supplementary Data.
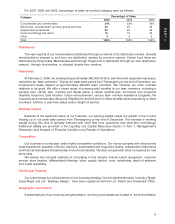
Analysis of Results of Operations
Revenues and Comparable-Store Sales
Sales include merchandise sales, net of expected returns, from our stores and our online business, as
well as gift card breakage. Refer to Note 2 for a definition of gift card breakage. Total revenues include sales
and credit card revenues. Total revenues do not include sales tax as we consider ourselves a pass-through
conduit for collecting and remitting sales taxes. Comparable-store sales are sales from our online business
and sales from general merchandise and SuperTarget stores open longer than one year, including:
• sales from stores that have been remodeled or expanded while remaining open
• sales from stores that have been relocated to new buildings of the same format within the same trade
area, in which the new store opens at about the same time as the old store closes
Comparable-store sales do not include:
• sales from general merchandise stores that have been converted, or relocated within the same trade
area, to a SuperTarget store format
• sales from stores that were intentionally closed to be remodeled, expanded or reconstructed
Comparable-store sales increases or decreases are calculated by comparing sales in current year periods
with comparable prior fiscal-year periods of equivalent length. The method of calculating comparable-store
sales varies across the retail industry.
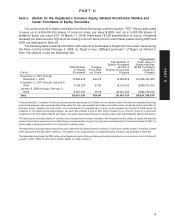
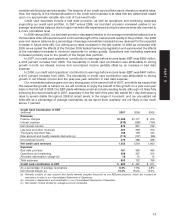
Revenue Growth 2007 2006 2005
Comparable-store sales 3.0% 4.8% 5.6%
Sales(a) 6.2% 12.9% 12.2%
Credit card revenues(a) 17.6% 19.5% 16.5%
Total revenues(a) 6.5% 13.1% 12.3%
(a) 2006 consisted of 53 weeks.
In 2007, a 52-week year following a 53-week year, total revenues were $63,367 million compared with
$59,490 in 2006, an increase of 6.5 percent. Total revenue growth was attributable to the opening of new
stores, a comparable-store sales increase of 3.0 percent and a 17.6 percent increase in credit card revenues.
These factors were partially offset by the impact of an extra week in 2006.
Comparable-store sales growth in 2007 was primarily attributable to growth in average transaction
amount. Comparable-store sales growth in 2006 was attributable to growth in average transaction amount
and the number of transactions in comparable stores. In each of the past several years, our comparable-store
sales growth has experienced a modest negative impact due to the transfer of sales to new stores. In 2007,
there was a deflationary impact of approximately 2 percent on sales growth compared with a deflationary
impact of 1 percent in 2006. In 2008, we expect sales growth to increase in the 8 to 9 percent range, reflecting
11
PART II