Target 2007 Annual Report Download - page 33
Download and view the complete annual report
Please find page 33 of the 2007 Target annual report below. You can navigate through the pages in the report by either clicking on the pages listed below, or by using the keyword search tool below to find specific information within the annual report.-
 1
1 -
2
-
3
-
4
-
5
-
6
-
7
-
8
-
9
-
10
-
11
-
12
-
13
-
14
-
15
-
16
-
17
-
18
-
19
-
20
-
21
-
22
-
 23
23 -
 24
24 -
 25
25 -
 26
26 -
 27
27 -
 28
28 -
 29
29 -
 30
30 -
 31
31 -
 32
32 -
 33
33 -
 34
34 -
 35
35 -
 36
36 -
 37
37 -
 38
38 -
 39
39 -
 40
40 -
 41
41 -
 42
42 -
 43
43 -
44
-
45
-
46
-
47
-
48
-
49
-
50
-
51
-
52
-
53
-
54
-
55
-
56
-
57
-
58
-
59
-
60
-
61
-
62
-
63
-
64
-
65
-
66
-
67
-
68
-
69
-
70
-
71
-
72
-
73
-
74
-
75
-
76
 |
 |

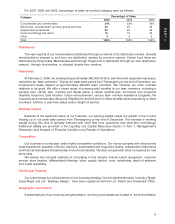
Analysis of Financial Condition
Liquidity and Capital Resources
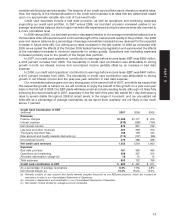
Our financial condition remains strong. In assessing our financial condition, we consider factors such as
cash flows provided by operations, capital expenditures and debt service obligations. Cash flow provided by
operations was $4,125 million in 2007 compared with $4,862 million in 2006, primarily due to significantly
greater growth in Target Visa accounts receivable and an investment in inventory growth, net of accounts
payable.
We continue to fund our growth and execute our share repurchase program through a combination of
internally generated funds and debt financing.
Our year-end gross receivables were $8,624 million compared with $6,711 million in 2006, an increase of
28.5 percent. This growth was driven by many factors, including a product change from proprietary Target
Cards to higher-limit Target Visa cards for a group of higher credit-quality Target Card Guests and the impact
of an industry-wide decline in payment rates. Average receivables in 2007 increased 18.1 percent. Given the
significant rate of growth of receivables in 2007, we expect that our average receivables balance during the
first half of 2008 will be significantly greater than that in 2007. Additionally, absent product changes for
additional Target Card holders in 2008, we expect that our year end 2008 receivable balance will rise only
modestly.
Year-end inventory levels increased $525 million, or 8.4 percent, reflecting the natural increase required to
support additional square footage and comparable-store sales growth. This growth was partially funded by an
increase in accounts payable over the same period.
During 2007, we repurchased 46.2 million shares of our common stock for a total cash investment of
$2,642 million ($57.24 per share). Of these repurchases, 26.5 million shares of our common stock for a total
cash investment of $1,445 million ($54.64 per share) were made under a $10 billion share repurchase plan
authorized by our Board of Directors in November 2007. We intend to complete this new share repurchase
program within approximately three years through open market transactions and other means. Under the right
combination of business results, liquidity and share price, we would expect to complete half, or more, of this
new program by the end of 2008. The remaining shares repurchased in 2007 were under the prior program.
Under the prior program that was originally approved in June 2004 and amended in November 2005 and
June 2007, we repurchased a total of 90.7 million shares of our common stock for a total investment of
$4,646 million ($51.20 per share) from June 2004 through November 2007. Additionally, in the fourth quarter
of 2007, we purchased and sold a series of call options at a net cost of $331 million on 30 million shares of our
common stock. The options expire in the first and second quarters of 2008. Refer to Note 24 for further details
of these instruments.
In 2006 we repurchased 19.5 million shares for a total investment of $977 million ($50.16 per share).
During 2007 and 2006 some of the shares repurchased were delivered upon the settlement of prepaid
forward contracts. The details of prepaid forward contract settlements and our long positions in prepaid
forward contracts have been provided in Note 24 and Note 26.
In 2007 we declared dividends of $.54 per share totaling $454 million, an increase of 14.6 percent over
2006. In 2006 we declared dividends of $.46 per share totaling $396 million, an increase of 18.6 percent over
2005. We have paid dividends every quarter since our first dividend was declared following our 1967 initial
public offering, and it is our intent to continue to do so in the future.
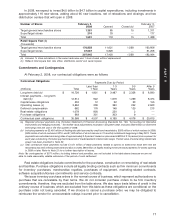
We believe that cash flows from operations, together with current levels of cash and cash equivalents,
proceeds from borrowings and/or the potential sale of some or all of our receivables, will be sufficient in 2008
to fund planned capital expenditures, dividends, share repurchases, growth in receivables, maturities of
long-term debt, seasonal inventory buildup and other cash requirements.
Our financing strategy is to ensure liquidity and access to capital markets, to manage our net exposure to
floating interest rate volatility and to maintain a balanced spectrum of debt maturities. Within these
parameters, we seek to minimize our cost of borrowing.
15
PART II