Target 2007 Annual Report Download - page 30
Download and view the complete annual report
Please find page 30 of the 2007 Target annual report below. You can navigate through the pages in the report by either clicking on the pages listed below, or by using the keyword search tool below to find specific information within the annual report.-
 1
1 -
2
-
3
-
4
-
5
-
6
-
7
-
8
-
9
-
10
-
11
-
12
-
13
-
14
-
15
-
16
-
17
-
18
-
19
-
 20
20 -
 21
21 -
 22
22 -
 23
23 -
 24
24 -
 25
25 -
 26
26 -
 27
27 -
 28
28 -
 29
29 -
 30
30 -
 31
31 -
 32
32 -
 33
33 -
 34
34 -
 35
35 -
 36
36 -
 37
37 -
 38
38 -
 39
39 -
 40
40 -
41
-
42
-
43
-
44
-
45
-
46
-
47
-
48
-
49
-
50
-
51
-
52
-
53
-
54
-
55
-
56
-
57
-
58
-
59
-
60
-
61
-
62
-
63
-
64
-
65
-
66
-
67
-
68
-
69
-
70
-
71
-
72
-
73
-
74
-
75
-
76
 |
 |
the continued contribution from new stores and an expected comparable store sales increase in the range of 2
to 3 percent. We do not expect inflation/deflation to have a significant effect on sales growth in 2008.
Beginning in 2007, we changed our definition of comparable-store sales to include sales from our online
business because we believe this combined measure represents a more useful disclosure in light of our fully
integrated, multi-channel approach to our business.
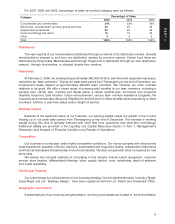
Gross Margin Rate
Gross margin rate represents gross margin (sales less cost of sales) as a percentage of sales. See Note 3
for a description of expenses included in cost of sales.
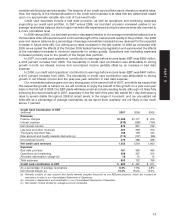
In 2007, our consolidated gross margin rate was 31.8 percent compared with 31.9 percent in 2006. Within
our gross margin rate for the year, we experienced a deterioration in markup due to sales mix. Markup is the
difference between an item’s cost and its retail price (expressed as a percentage of its retail price). Factors that
affect markup include vendor offerings and negotiations, vendor income, sourcing strategies, market forces
like the cost of raw materials and freight, and competitive influences. Markdowns are the reduction in the
original or previous price of retail merchandise. Factors that affect markdowns include inventory management
and competitive influences. The definition and method of calculating markup, markdowns and gross margin
varies across the retail industry.
In 2006, our consolidated gross margin rate was 31.9 percent compared with 31.9 percent in 2005. Within
our gross margin rate for 2006, we experienced an increase in markup, which was offset by an increase in
markdowns.
In 2008 we expect our gross margin rate to decrease modestly from 2007.
Selling, General and Administrative Expense Rate
Our selling, general and administrative (SG&A) expense rate represents SG&A expenses as a percentage
of sales. See Note 3 for a description of expenses included in SG&A expenses. SG&A expenses exclude
depreciation and amortization, as well as expenses associated with our credit card operations, which are
reflected separately in our Consolidated Statements of Operations.
In 2007 our SG&A expense rate was 22.3 percent compared with 22.2 percent in 2006. Within SG&A
expenses in 2007 there were no expense categories that experienced a significant fluctuation in expenses as a
percentage of sales, when compared with 2006.
In 2006, our SG&A expense rate was 22.2 percent compared with 21.8 percent in 2005. This increase was
primarily due to higher store payroll costs, the year-over-year impact of reduced transition services income
related to our 2004 divestiture of Mervyn’s and the $27 million Visa/MasterCard settlement that reduced SG&A
expense in 2005.
In 2008, we expect our SG&A expense rate to be approximately equal to our 2007 rate.
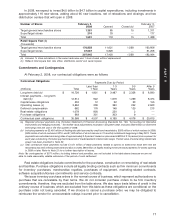
Credit Card Contribution
We offer credit to qualified guests through our REDcard products, the Target Visa and the Target Card.
Our credit card program strategically supports our core retail operations and remains an important contributor
to our overall profitability. Our credit card revenues are comprised of finance charges, late fees and other
revenues. In addition, we receive fees from merchants who accept the Target Visa credit card. Effective
February 2007, we redefined Credit Card Contribution to Earnings Before Taxes (EBT) to exclude intra-
company merchant fees and include the effect of new account and loyalty rewards discounts as expenses of
our credit card programs. We have reclassified prior period amounts to conform to the current year disclosure.
These changes were made to better facilitate comparison of our credit card results to the performance of other
bank card portfolios and to better facilitate comparison of our core retail operations to other retailers who have
sold their credit card portfolios to third parties. These reclassifications had no effect on our Consolidated
Statements of Operations. In 2007, our net credit card revenues increased primarily due to an 18.1 percent
increase in average receivables, combined with a moderate increase in the yield on those receivables. Late
fees and other revenue of $422 million benefited from a change in terms for the Target Card portfolio.
Our credit card operations are allocated a portion of consolidated interest expense based on estimated
funding costs for average net accounts receivable and other financial services assets. Our allocation
methodology assumes that 90 percent of the sum of average net receivables and other financial services
assets are debt-financed with a mix of fixed rate and variable rate debt in proportion to the mix of fixed and
12