Target 2007 Annual Report Download - page 48
Download and view the complete annual report
Please find page 48 of the 2007 Target annual report below. You can navigate through the pages in the report by either clicking on the pages listed below, or by using the keyword search tool below to find specific information within the annual report.-
 1
1 -
2
-
3
-
4
-
5
-
6
-
7
-
8
-
9
-
10
-
11
-
12
-
13
-
14
-
15
-
16
-
17
-
18
-
19
-
20
-
21
-
22
-
23
-
24
-
25
-
26
-
27
-
28
-
29
-
30
-
31
-
32
-
33
-
34
-
35
-
36
-
37
-
 38
38 -
 39
39 -
 40
40 -
 41
41 -
 42
42 -
 43
43 -
 44
44 -
 45
45 -
 46
46 -
 47
47 -
 48
48 -
 49
49 -
 50
50 -
 51
51 -
 52
52 -
 53
53 -
 54
54 -
 55
55 -
 56
56 -
 57
57 -
 58
58 -
59
-
60
-
61
-
62
-
63
-
64
-
65
-
66
-
67
-
68
-
69
-
70
-
71
-
72
-
73
-
74
-
75
-
76
 |
 |

charged for merchandise shipments that do not meet our requirements (‘‘violations’’), such as late or
incomplete shipments. These allowances are recorded when violations occur. Substantially all consideration
received is recorded as a reduction of cost of sales.
We establish a receivable for vendor income that is earned but not yet received. Based on provisions of
the agreements in place, this receivable is computed by estimating when we have completed our
performance and the amount earned. We perform detailed analyses to determine the appropriate level of the
receivable in the aggregate. The majority of year-end receivables associated with these activities are collected
within the following fiscal quarter.
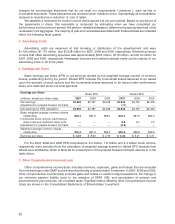
5. Advertising Costs
Advertising costs are expensed at first showing or distribution of the advertisement and were
$1,195 million, $1,170 million, and $1,028 million for 2007, 2006 and 2005, respectively. Advertising vendor
income that offset advertising expenses was approximately $123 million, $118 million, and $110 million for
2007, 2006 and 2005, respectively. Newspaper circulars and media broadcast made up the majority of our
advertising costs in all three years.
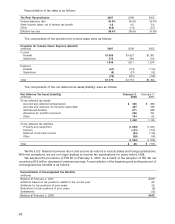
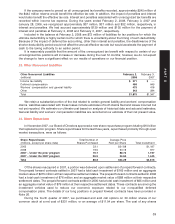
6. Earnings per Share
Basic earnings per share (EPS) is net earnings divided by the weighted average number of common
shares outstanding during the period. Diluted EPS includes the incremental shares assumed to be issued
upon the exercise of stock options and the incremental shares assumed to be issued under performance
share and restricted stock unit arrangements.
Earnings per Share Basic EPS Diluted EPS
(millions, except per share data) 2007 2006 2005 2007 2006 2005
Net earnings $2,849 $2,787 $2,408 $2,849 $2,787 $2,408
Adjustment for prepaid forward contracts ———(11) ——
Net earnings for EPS calculation $2,849 $2,787 $2,408 $2,838 $2,787 $2,408
Basic weighted average common shares
outstanding 845.4 861.9 882.0 845.4 861.9 882.0
Incremental stock options, performance
share units and restricted stock units ———6.0 6.7 7.2
Adjustment for prepaid forward contracts ———(0.6) ——
Weighted average common shares
outstanding 845.4 861.9 882.0 850.8 868.6 889.2
Earnings per share $ 3.37 $ 3.23 $ 2.73 $ 3.33 $ 3.21 $ 2.71
For the 2007, 2006 and 2005 EPS computations, 6.3 million, 1.8 million and 4.4 million stock options,
respectively, were excluded from the calculation of weighted average shares for diluted EPS because their
effects were antidilutive. Refer to Note 26 for a description of the prepaid forward contracts referred to in the
table above.
7. Other Comprehensive Income/(Loss)
Other comprehensive income/(loss) includes revenues, expenses, gains and losses that are excluded
from net earnings under GAAP and are recorded directly to shareholders’ investment. In 2007, 2006 and 2005,
other comprehensive income/(loss) included gains and losses on certain hedge transactions, the change in
our minimum pension liability (prior to the adoption of SFAS 158), and amortization of pension and
post-retirement plan amounts, net of related taxes. Significant items affecting other comprehensive income/
(loss) are shown in the Consolidated Statements of Shareholders’ Investment.
30