Target 2007 Annual Report Download - page 32
Download and view the complete annual report
Please find page 32 of the 2007 Target annual report below. You can navigate through the pages in the report by either clicking on the pages listed below, or by using the keyword search tool below to find specific information within the annual report.-
 1
1 -
2
-
3
-
4
-
5
-
6
-
7
-
8
-
9
-
10
-
11
-
12
-
13
-
14
-
15
-
16
-
17
-
18
-
19
-
20
-
21
-
 22
22 -
 23
23 -
 24
24 -
 25
25 -
 26
26 -
 27
27 -
 28
28 -
 29
29 -
 30
30 -
 31
31 -
 32
32 -
 33
33 -
 34
34 -
 35
35 -
 36
36 -
 37
37 -
 38
38 -
 39
39 -
 40
40 -
 41
41 -
 42
42 -
43
-
44
-
45
-
46
-
47
-
48
-
49
-
50
-
51
-
52
-
53
-
54
-
55
-
56
-
57
-
58
-
59
-
60
-
61
-
62
-
63
-
64
-
65
-
66
-
67
-
68
-
69
-
70
-
71
-
72
-
73
-
74
-
75
-
76
 |
 |

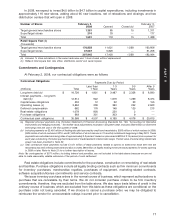
Receivables
(millions) 2007 2006 2005
Year-end receivables $8,624 $6,711 $6,117
Average receivables $7,275 $6,161 $5,544
Accounts with three or more payments (60+ days) past due as a
percentage of year-end receivables 4.0% 3.5% 2.8%
Accounts with four or more payments (90+ days) past due as a percentage
of year-end receivables 2.7% 2.4% 1.9%
Allowance for Doubtful Accounts
(millions) 2007 2006 2005
Allowance at beginning of year $ 517 $ 451 $ 387
Bad debt provision 481 380 466
Net write-offs (428) (314) (402)
Allowance at end of year $ 570 $ 517 $ 451
As a percentage of year-end receivables 6.6% 7.7% 7.4%
Net write-offs as a percentage of average receivables 5.9% 5.1% 7.2%
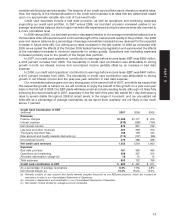
We offer new account discounts and rewards programs on our REDcard products. These discounts and
rewards are redeemable only on purchases made at Target. The discounts associated with our REDcard
products are included as reductions in sales in our Consolidated Statements of Operations and were
$108 million, $104 million and $97 million in 2007, 2006 and 2005, respectively.
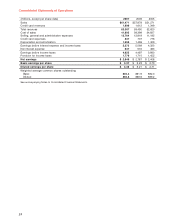
Depreciation and Amortization
In 2007, depreciation and amortization expense totaled $1,659 million, an increase of 10.9 percent. The
increase was due to increased capital expenditures, specifically related to investments in new stores. In 2006,
depreciation and amortization expense increased 6.1 percent, to $1,496 million. During 2006, we adjusted the
period over which we amortize leasehold acquisition costs to match the expected terms for individual leases,
resulting in a cumulative benefit to depreciation and amortization expense of approximately $28 million. We
expect 2008 depreciation and amortization expense to be approximately $1.9 billion.
Net Interest Expense
In 2007, net interest expense was $647 million compared with $572 million in 2006, an increase of
13.2 percent. This increase related to higher average debt balances, including the debt to fund growth in
accounts receivable, partially offset by the benefit of one less week. The average portfolio interest rate was
6.1 percent in 2007 and 6.2 percent in 2006.
In 2006, net interest expense was $572 million compared with $463 million in 2005, an increase of
23.4 percent. This increase related primarily to growth in the cost of funding our credit card operations and
was also unfavorably impacted by the 53rd week in 2006. The average portfolio interest rate was 6.2 percent in
2006 and 5.9 percent in 2005.
Our 2008 net interest expense is expected to increase due to significantly higher average net debt
balances.
Provision for Income Taxes
Our effective income tax rate was 38.4 percent in 2007, 38.0 percent in 2006 and 37.6 percent in 2005.
The increase in 2007 was primarily due to the less favorable impact that capital market returns had on certain
book to tax differences during 2007, compared to the more favorable returns in 2006. Our lower 2005 effective
rate was due to the favorable resolution of various tax matters in 2005. We do not expect our 2008 effective
income tax rate to change significantly from 2007.
14