Target 2007 Annual Report Download - page 31
Download and view the complete annual report
Please find page 31 of the 2007 Target annual report below. You can navigate through the pages in the report by either clicking on the pages listed below, or by using the keyword search tool below to find specific information within the annual report.-
 1
1 -
2
-
3
-
4
-
5
-
6
-
7
-
8
-
9
-
10
-
11
-
12
-
13
-
14
-
15
-
16
-
17
-
18
-
19
-
20
-
 21
21 -
 22
22 -
 23
23 -
 24
24 -
 25
25 -
 26
26 -
 27
27 -
 28
28 -
 29
29 -
 30
30 -
 31
31 -
 32
32 -
 33
33 -
 34
34 -
 35
35 -
 36
36 -
 37
37 -
 38
38 -
 39
39 -
 40
40 -
 41
41 -
42
-
43
-
44
-
45
-
46
-
47
-
48
-
49
-
50
-
51
-
52
-
53
-
54
-
55
-
56
-
57
-
58
-
59
-
60
-
61
-
62
-
63
-
64
-
65
-
66
-
67
-
68
-
69
-
70
-
71
-
72
-
73
-
74
-
75
-
76
 |
 |

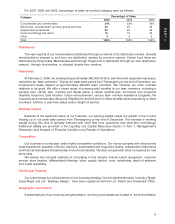
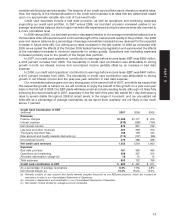
variable rate financial services assets. The majority of our credit card portfolio earns interest at variable rates;
thus, the majority of the interest allocation to the credit card business is at rates that are determined based
upon our approximate variable rate cost of borrowed funds.
Credit card expenses include a bad debt provision, as well as operations and marketing expenses
supporting our credit card portfolio. In 2007 versus 2006, our bad debt provision increased relative to our
average receivables balance due to higher net write-offs experienced during the year as write-offs returned to
a more normalized level.
In 2006 versus 2005, our bad debt provision decreased relative to our average receivables balance due to
the favorable write-off experience and continued strength of the overall credit quality of the portfolio. Our 2006
year-end reserve balance as a percentage of average receivables increased as we reserved for the expected
increase in future write-offs. Our delinquency rates increased in the last quarter of 2006 as compared with
2005 as we cycled the effects of the October 2005 federal bankruptcy legislation and experienced the effects
of the mandated increases in minimum payments for certain guests. Operations and marketing expenses
increased primarily due to the growth of the Target Visa portfolio.
In 2007, our credit card operations’ contribution to earnings before income taxes (EBT) was $600 million,
a 20.8 percent increase from 2006. The favorability in credit card contribution was attributable to strong
growth in both net interest income and non-interest income partially offset by an increase in bad debt
expense.
In 2006, our credit card operations’ contribution to earnings before income taxes (EBT) was $497 million,
a 83.5 percent increase from 2005. The favorability in credit card contribution was attributable to strong
growth in net interest income and the year-over-year reduction in bad debt expense.
Our receivables balance grew at a very strong pace in the second half of 2007, and while we expect that
this sequential growth is behind us, we will continue to enjoy the benefit of this growth on a year-over-year
basis in the first half of 2008. Our EBT yields will likely remain at industry-leading levels, although not likely fully
achieving the record levels set in 2007, especially in the first half of the year. We expect 60+ day delinquency
rates to remain stable throughout 2008 at recent levels, in the range of 4 percent, and our annualized net
write-offs as a percentage of average receivables, as we report them quarterly, are not likely to rise much
above 7 percent.
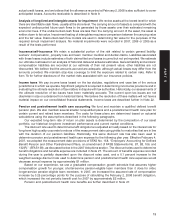
Credit Card Contribution to EBT
(millions) 2007 2006 2005
Revenues
Finance charges $1,308 $1,117 $ 915
Interest expense (330) (286) (193)
Net interest income 978 831 722
Late fees and other revenues 422 356 310
Third-party merchant fees 166 139 124
New account and loyalty rewards discounts (a) (113) (107) (96)
Non-interest income 475 388 338
Net credit card revenues 1,453 1,219 1,060
Expenses
Bad debt provision 481 380 466
Operations and marketing 356 327 310
Allocated depreciation charge (b) 16 15 13
Total expenses 853 722 789
Credit card contribution to EBT $ 600 $ 497 $ 271
As a percentage of average receivables 8.3% 7.9% 4.9%
Net interest margin (c) 13.4% 13.2% 13.0%
(a) Primarily consists of new account and loyalty rewards program discounts on our REDcard products, which are included as
reductions of sales in our Consolidated Statements of Operations.
(b) Included in depreciation and amortization in our Consolidated Statements of Operations.
(c) Net interest income divided by average accounts receivable.
13
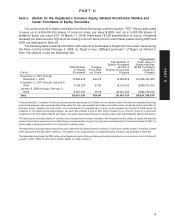
PART II