Target 2007 Annual Report Download - page 64
Download and view the complete annual report
Please find page 64 of the 2007 Target annual report below. You can navigate through the pages in the report by either clicking on the pages listed below, or by using the keyword search tool below to find specific information within the annual report.-
 1
1 -
2
-
3
-
4
-
5
-
6
-
7
-
8
-
9
-
10
-
11
-
12
-
13
-
14
-
15
-
16
-
17
-
18
-
19
-
20
-
21
-
22
-
23
-
24
-
25
-
26
-
27
-
28
-
29
-
30
-
31
-
32
-
33
-
34
-
35
-
36
-
37
-
38
-
39
-
40
-
41
-
42
-
43
-
44
-
45
-
46
-
47
-
48
-
49
-
50
-
51
-
52
-
53
-
 54
54 -
 55
55 -
 56
56 -
 57
57 -
 58
58 -
 59
59 -
 60
60 -
 61
61 -
 62
62 -
 63
63 -
 64
64 -
 65
65 -
 66
66 -
 67
67 -
 68
68 -
 69
69 -
 70
70 -
 71
71 -
 72
72 -
 73
73 -
 74
74 -
75
-
76
 |
 |

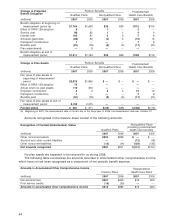
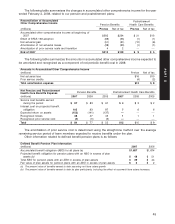
Assumptions
Weighted average assumptions used to determine benefit obligations as of the measurement date were
as follows:
Postretirement
Weighted Average Assumptions Health Care BenefitsPension Benefits
2007 2006 2007 2006
Discount rate 6.45% 5.80% 6.45% 5.80%
Average assumed rate of compensation increase 4.25% 4.00% n/a n/a
(a) Beginning in 2007, the measurement date is the last day of the fiscal year. In 2006, the measurement date was October 31.
Weighted average assumptions used to determine net periodic benefit expense for each fiscal year were
as follows:
Postretirement
Weighted Average Assumptions Pension Benefits Health Care Benefits
2007 2006 2005 2007 2006 2005
Discount rate 5.95% 5.75% 5.75% 5.95% 5.75% 5.75%
Expected long-term rate of return
on plan assets 8.00% 8.00% 8.00% n/a n/a n/a
Average assumed rate of
compensation increase 4.25% 3.50% 2.75% n/a n/a n/a
The discount rate used to measure net periodic benefit expense each year is the rate as of the beginning
of the year (i.e., the prior measurement date). With an essentially stable asset allocation over the following
time periods, our annualized rate of return on qualified plans’ assets has averaged 13.6 percent, 8 percent and
10.2 percent for the 5-year, 10-year and 15-year periods, respectively, ending February 2, 2008.
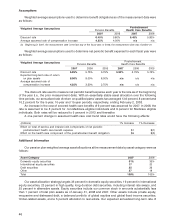
An increase in the cost of covered health care benefits of 9 percent was assumed for 2007. In 2008, the
rate is assumed to be 8 percent for non-Medicare eligible individuals and 9 percent for Medicare eligible
individuals. Both rates will be reduced to 5 percent in 2013 and thereafter.
A one percent change in assumed health care cost trend rates would have the following effects:
(millions) 1% Increase 1% Decrease
Effect on total of service and interest cost components of net periodic
postretirement health care benefit expense $1 $(1)
Effect on the health care component of the postretirement benefit obligation $6 $(5)
Additional Information
Our pension plan weighted average asset allocations at the measurement date by asset category were as
follows:
Asset Category 2007 2006
Domestic equity securities 31% 35%
International equity securities 17 20
Debt securities 25 26
Other 27 19
Total 100% 100%
Our asset allocation strategy targets 33 percent in domestic equity securities, 19 percent in international
equity securities, 23 percent in high quality, long-duration debt securities, including interest rate swaps, and
25 percent in alternative assets. Equity securities include our common stock in amounts substantially less
than 1 percent of total plan assets as of January 31, 2008 and 2007. Other assets include private equity,
mezzanine and distressed debt, a balanced portfolio of global equities and global fixed income securities,
timber-related assets, and a 5 percent allocation to real estate. Our expected annualized long-term rate of
46