Target 2007 Annual Report Download - page 63
Download and view the complete annual report
Please find page 63 of the 2007 Target annual report below. You can navigate through the pages in the report by either clicking on the pages listed below, or by using the keyword search tool below to find specific information within the annual report.-
 1
1 -
2
-
3
-
4
-
5
-
6
-
7
-
8
-
9
-
10
-
11
-
12
-
13
-
14
-
15
-
16
-
17
-
18
-
19
-
20
-
21
-
22
-
23
-
24
-
25
-
26
-
27
-
28
-
29
-
30
-
31
-
32
-
33
-
34
-
35
-
36
-
37
-
38
-
39
-
40
-
41
-
42
-
43
-
44
-
45
-
46
-
47
-
48
-
49
-
50
-
51
-
52
-
 53
53 -
 54
54 -
 55
55 -
 56
56 -
 57
57 -
 58
58 -
 59
59 -
 60
60 -
 61
61 -
 62
62 -
 63
63 -
 64
64 -
 65
65 -
 66
66 -
 67
67 -
 68
68 -
 69
69 -
 70
70 -
 71
71 -
 72
72 -
 73
73 -
74
-
75
-
76
 |
 |

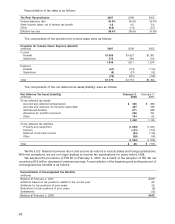
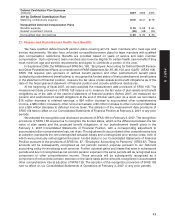
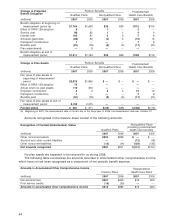
The following table summarizes the changes in accumulated other comprehensive income for the year
ended February 2, 2008, related to our pension and postretirement plans:
Reconciliation of Accumulated Postretirement
Other Comprehensive Income Pension Benefits Health Care Benefits
(millions) Pre-tax Net of tax Pre-tax Net of tax
Accumulated other comprehensive income at beginning of
2007 $385 $234 $ 21 $13
Effect of SFAS 158 adoption (88) (53) (1) (1)
Net actuarial gain (51) (31) (10) (6)
Amortization of net actuarial losses (38) (23) (1) (1)
Amortization of prior service costs and transition 4 2 — —
End of 2007 $212 $129 $ 9 $ 5
The following table summarizes the amounts in accumulated other comprehensive income expected to
be amortized and recognized as a component of net periodic benefit cost in 2008:
Amounts in Accumulated Other Comprehensive Income
(millions) Pre-tax Net of tax
Net actuarial loss $16 $10
Prior service credits (4) (2)
Total amortization expense $12 $ 8
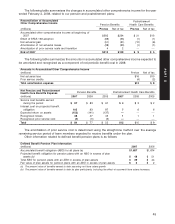
Net Pension and Postretirement Pension Benefits Postretirement Health Care Benefits
Health Care Benefits Expense
(millions) 2007 2006 2005 2007 2006 2005
Service cost benefits earned
during the period $97 $83 $67 $4 $3 $2
Interest cost on projected benefit
obligation 105 93 87 766
Expected return on assets (152) (141) (137) ———
Recognized losses 38 47 43 111
Recognized prior service cost (4) (5) (5) ———
Total $ 84 $77 $55 $12 $10 $ 9
The amortization of prior service cost is determined using the straight-line method over the average
remaining service period of team members expected to receive benefits under the plan.
Other information related to defined benefit pension plans is as follows:
Defined Benefit Pension Plan Information
(millions) 2007 2006
Accumulated benefit obligation (ABO) for all plans (a) $1,687 $1,674
Projected benefit obligation for pension plans with an ABO in excess of plan
assets (b) $48 $51
Total ABO for pension plans with an ABO in excess of plan assets $39 $44
Fair value of plan assets for pension plans with an ABO in excess of plan assets $2 $2
(a) The present value of benefits earned to date assuming no future salary growth.
(b) The present value of benefits earned to date by plan participants, including the effect of assumed future salary increases.
45
PART II