Target 2007 Annual Report Download - page 65
Download and view the complete annual report
Please find page 65 of the 2007 Target annual report below. You can navigate through the pages in the report by either clicking on the pages listed below, or by using the keyword search tool below to find specific information within the annual report.-
 1
1 -
2
-
3
-
4
-
5
-
6
-
7
-
8
-
9
-
10
-
11
-
12
-
13
-
14
-
15
-
16
-
17
-
18
-
19
-
20
-
21
-
22
-
23
-
24
-
25
-
26
-
27
-
28
-
29
-
30
-
31
-
32
-
33
-
34
-
35
-
36
-
37
-
38
-
39
-
40
-
41
-
42
-
43
-
44
-
45
-
46
-
47
-
48
-
49
-
50
-
51
-
52
-
53
-
54
-
 55
55 -
 56
56 -
 57
57 -
 58
58 -
 59
59 -
 60
60 -
 61
61 -
 62
62 -
 63
63 -
 64
64 -
 65
65 -
 66
66 -
 67
67 -
 68
68 -
 69
69 -
 70
70 -
 71
71 -
 72
72 -
 73
73 -
 74
74 -
 75
75 -
76
 |
 |

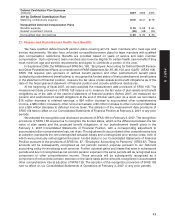
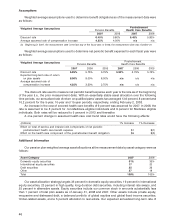
return assumptions as of January 31, 2008 were 8.5 percent for domestic and international equity securities,
5.5 percent for long duration debt securities, and 9.5 percent for other assets.
Contributions
Given the qualified pension plan’s funded position, we are not required to make any contributions in
2008, although we may choose to make discretionary contributions of up to $100 million. We expect to make
contributions in the range of $5 million to $15 million to our postretirement health care benefit plan in 2008.
Estimated Future Benefit Payments
Benefit payments by the plans, which reflect expected future service as appropriate, are expected to be
paid as follows:
Estimated Future Benefit Payments Postretirement
Pension Health Care
(millions) Benefits Benefits
2008 $101 $ 9
2009 108 9
2010 113 10
2011 118 10
2012 125 11
2013-2017 737 65
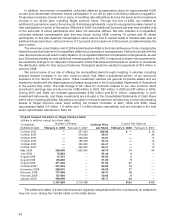
28. Quarterly Results (Unaudited)
Due to the seasonal nature of our business, fourth quarter operating results typically represent a
substantially larger share of total year revenues and earnings because they include our peak sales period
from Thanksgiving through the end of December. We follow the same accounting policies for preparing
quarterly and annual financial data. The table below summarizes quarterly results for 2007 and 2006:
Quarterly Results First Quarter Second Quarter Third Quarter Fourth Quarter Total Year
(millions, except per share data) 2007 2006 2007 2006 2007 2006 2007 2006(b) 2007 2006(b)
Total revenues $14,041 $12,863 $14,620 $13,347 $14,835 $13,570 $19,872 $19,710 $63,367 $59,490
Gross margin $ 4,437 $ 4,020 $ 4,728 $ 4,273 $ 4,571 $ 4,265 $ 5,841 $ 5,920 $19,576 $18,479
Net earnings $ 651 $ 554 $ 686 $ 609 $ 483 $ 506 $ 1,028 $ 1,119 $ 2,849 $ 2,787
Basic earnings per share (a) $ .76 $ .64 $ .81 $ .71 $ .57 $ .59 $ 1.24 $ 1.30 $ 3.37 $ 3.23
Diluted earnings per share (a) $ .75 $ .63 $ .80 $ .70 $ .56 $ .59 $ 1.23 $ 1.29 $ 3.33 $ 3.21
Dividends declared per share $ .12 $ .10 $ .14 $ .12 $ .14 $ .12 $ .14 $ .12 $ .54 $ .46
Closing common stock price
High $ 64.32 $ 55.80 $ 70.14 $ 54.71 $ 67.57 $ 59.72 $ 60.13 $ 62.35 $ 70.14 $ 62.35
Low $ 58.58 $ 50.85 $ 57.31 $ 45.53 $ 58.11 $ 45.28 $ 48.08 $ 56.03 $ 48.08 $ 45.28
(a) Per share amounts are computed independently for each of the quarters presented. The sum of the quarters may not equal the total
year amount due to the impact of changes in average quarterly shares outstanding.
(b) Fiscal year 2006 consisted of 53 weeks.
Note: Additionally, the sum of the quarterly amounts may not equal the total year amounts due to rounding.
29. Subsequent Event
Subsequent to February 2, 2008, we terminated interest rate swaps with a notional value of $3,125 million
for cash proceeds of $160 million. These interest rate swaps were designated as fair value hedges; therefore,
the valuation adjustments will be amortized to earnings over the remaining life of the related hedged debt. In
2008, we expect to amortize approximately $42 million into earnings as a reduction of interest expense related
to these agreements.
47
PART II