Verizon Wireless 2010 Annual Report Download - page 15
Download and view the complete annual report
Please find page 15 of the 2010 Verizon Wireless annual report below. You can navigate through the pages in the report by either clicking on the pages listed below, or by using the keyword search tool below to find specific information within the annual report.-
 1
1 -
2
-
3
-
4
-
 5
5 -
 6
6 -
 7
7 -
 8
8 -
 9
9 -
 10
10 -
 11
11 -
 12
12 -
 13
13 -
 14
14 -
 15
15 -
 16
16 -
 17
17 -
 18
18 -
 19
19 -
 20
20 -
 21
21 -
 22
22 -
 23
23 -
 24
24 -
 25
25 -
26
-
27
-
28
-
29
-
30
-
31
-
32
-
33
-
34
-
35
-
36
-
37
-
38
-
39
-
40
-
41
-
42
-
43
-
44
-
45
-
46
-
47
-
48
-
49
-
50
-
51
-
52
-
53
-
54
-
55
-
56
-
57
-
58
-
59
-
60
-
61
-
62
-
63
-
64
-
65
-
66
-
67
-
68
-
69
-
70
-
71
-
72
-
73
-
74
-
75
-
76
-
77
-
78
-
79
-
80
 |
 |

13
Selected Financial Data – As Adjusted*
VERIZON COMMUNICATIONS INC. AND SUBSIDIARIES
Verizon S&P 500 Telecom Services S&P 500
Stock Performance Graph
$100
$80
$60
$40
$140
$120
$160
$180
2005 2006 2007 2008 2009 2010
Dollars
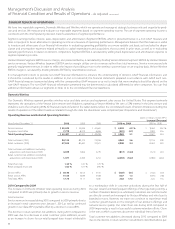
Comparison of Five-Year Total Return Among Verizon, S&P 500 Telecommunications Services Index and S&P 500 Stock Index
The graph compares the cumulative total returns of Verizon, the S&P 500 Telecommunications Services Index, and the S&P 500 Stock Index over a five-year period, adjusted for the spin-off of
our local exchange business and related landline activities in predominantly rural areas in 14 states, completed in 2010, and in Maine, New Hampshire and Vermont, completed in 2008, and our
domestic yellow pages directories business, completed in 2006. It assumes $100 was invested on December 31, 2005, with dividends reinvested.
Data Points in Dollars
At December 31,
2005 2006 2007 2008 2009 2010
Verizon 100.0 134.6 164.3 134.6 139.8 172.1
S&P Telecom Services 100.0 136.7 152.9 106.3 115.8 137.8
S&P 500 100.0 115.8 122.1 77.0 97.3 112.0
(dollars in millions, except per share amounts)
2010 2009 2008 2007 2006
Results of Operations
Operating revenues $ 106,565 $ 107,808 $ 97,354 $ 93,469 $ 88,182
Operating income 14,645 15,978 2,612 17,816 17,137
Income (loss) before discontinued operations, extraordinary item
and cumulative effect of accounting change attributable
to Verizon 2,549 4,894 (2,193) 7,201 7,763
Per common share – basic .90 1.72 (.77) 2.48 2.67
Per common share – diluted .90 1.72 (.77) 2.48 2.64
Net income (loss) attributable to Verizon 2,549 4,894 (2,193) 7,212 8,480
Per common share – basic .90 1.72 (.77) 2.49 2.91
Per common share – diluted .90 1.72 (.77) 2.49 2.89
Cash dividends declared per common share 1.925 1.870 1.780 1.670 1.620
Net income attributable to noncontrolling interest 7,668 6,707 6,155 5,053 4,038
Financial Position
Total assets $ 220,005 $ 226,907 $ 202,185 $ 186,942 $ 189,072
Debt maturing within one year 7,542 7,205 4,993 2,954 7,715
Long-term debt 45,252 55,051 46,959 28,203 28,646
Employee benefit obligations 28,164 32,622 32,512 29,960 30,779
Noncontrolling interest 48,343 42,761 37,199 32,266 28,310
Equity attributable to Verizon 38,569 41,382 41,592 50,580 48,830
• Significanteventsaffectingourhistoricalearningstrendsin2008through2010aredescribedin“Management’sDiscussionandAnalysisofFinancialConditionandResultsofOperations.”
• 2007dataincludessalesofbusiness,severance,pensionandbenefitcharges,mergerintegrationcosts,andotheritems.
• 2006dataincludessalesofbusiness,severance,pensionandbenefitcharges,mergerintegrationcosts,aswellasrelocationchargesandotheritems.
* During 2010, we retrospectively changed our method of accounting for benefit plans as described in Note 1 to the consolidated financial statements. As a result, all prior periods have
been adjusted.