Verizon Wireless 2010 Annual Report Download - page 33
Download and view the complete annual report
Please find page 33 of the 2010 Verizon Wireless annual report below. You can navigate through the pages in the report by either clicking on the pages listed below, or by using the keyword search tool below to find specific information within the annual report.-
 1
1 -
2
-
3
-
4
-
5
-
6
-
7
-
8
-
9
-
10
-
11
-
12
-
13
-
14
-
15
-
16
-
17
-
18
-
19
-
20
-
21
-
22
-
 23
23 -
 24
24 -
 25
25 -
 26
26 -
 27
27 -
 28
28 -
 29
29 -
 30
30 -
 31
31 -
 32
32 -
 33
33 -
 34
34 -
 35
35 -
 36
36 -
 37
37 -
 38
38 -
 39
39 -
 40
40 -
 41
41 -
 42
42 -
 43
43 -
44
-
45
-
46
-
47
-
48
-
49
-
50
-
51
-
52
-
53
-
54
-
55
-
56
-
57
-
58
-
59
-
60
-
61
-
62
-
63
-
64
-
65
-
66
-
67
-
68
-
69
-
70
-
71
-
72
-
73
-
74
-
75
-
76
-
77
-
78
-
79
-
80
 |
 |

31
Management’sDiscussionandAnalysis
ofFinancialConditionandResultsofOperations – As Adjusted continued
Credit Ratings
The debt securities of Verizon Communications and its subsidiaries con-
tinue to be accorded high ratings by the three primary rating agencies.
Although a one-level ratings downgrade would not be expected to sig-
nificantly impact our access to capital, it could increase both the cost
of refinancing existing debt and the cost of financing any new capital
requirements. Securities ratings assigned by rating organizations are
expressions of opinion and are not recommendations to buy, sell, or hold
securities. A securities rating is subject to revision or withdrawal at any
time by the assigning rating organization. Each rating should be evalu-
ated independently of any other rating.
Covenants
Our credit agreements contain covenants that are typical for large,
investment grade companies. These covenants include requirements to
pay interest and principal in a timely fashion, pay taxes, maintain insur-
ance with responsible and reputable insurance companies, preserve our
corporate existence, keep appropriate books and records of financial
transactions, maintain our properties, provide financial and other reports
to our lenders, limit pledging and disposition of assets and mergers and
consolidations, and other similar covenants.
We and our consolidated subsidiaries are in compliance with all debt
covenants.
Increase (Decrease) In Cash and Cash Equivalents
Our Cash and cash equivalents at December 31, 2010 totaled $6.7 bil-
lion, a $4.7 billion increase compared to Cash and cash equivalents at
December 31, 2009 for the reasons discussed above. Our Cash and cash
equivalents at December 31, 2009 totaled $2.0 billion, a $7.8 billion
decrease compared to Cash and cash equivalents at December 31, 2008
for the reasons discussed above.
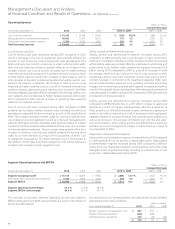
Free Cash Flow
Free cash flow is a non-GAAP financial measure that management believes
isusefultoinvestorsandotherusersofVerizon’sfinancialinformationin
evaluating cash available to pay debt and dividends. Free cash flow is
calculated by subtracting capital expenditures from net cash provided by
operating activities. The following table reconciles net cash provided by
operating activities to free cash flow:
(dollars in millions)
Years Ended December 31, 2010 2009 2008
Net cash provided by operating activities $ 33,363 $ 31,390 $ 27,452
Less Capital expenditures (including
capitalized software) 16,458 16,872 17,133
Free cash flow $ 16,905 $ 14,518 $ 10,319
the 364-Day Credit Agreement in order to purchase Alltel debt obliga-
tions acquired in the second quarter of 2008 and, during the third quarter
of 2008, borrowed $2.8 billion under the delayed draw facility to com-
pletethepurchaseofRuralCellularandtorepayRuralCellular’sdebtand
pay fees and expenses incurred in connection therewith. During 2008,
the borrowings under the 364-Day Credit Agreement were repaid.
Other, net
The increase in Other, net financing activities during 2010 and 2009
was primarily driven by higher distributions to Vodafone, which owns a
45% noncontrolling interest in Verizon Wireless. In addition, Other, net
financing activities during 2009 included the buyout of wireless part-
nerships in which our ownership interests increased as a result of the
acquisition of Alltel.
Credit Facility and Shelf Registration
On April 14, 2010, we terminated all commitments under our previous
$5.3 billion 364-day credit facility with a syndicate of lenders and entered
into a new $6.2 billion three-year credit facility with a group of major finan-
cial institutions. As of December 31, 2010, the unused borrowing capacity
under the three-year credit facility was approximately $6.1 billion.
The credit facility does not require us to comply with financial covenants
or maintain specified credit ratings, and it permits us to borrow even if
our business has incurred a material adverse change. We use the credit
facility to support the issuance of commercial paper, for the issuance of
letters of credit and for general corporate purposes.
We have a shelf registration available for the issuance of up to $4.0 billion
of additional unsecured debt or equity securities.
Verizon’sratioofdebttodebtcombinedwithVerizon’sequitywas57.8%
at December 31, 2010 compared to 60.1% at December 31, 2009.
Dividends Paid
During 2010, we paid $5.4 billion in dividends compared to $5.3 billion
in 2009 and $5.0 billion in 2008. As in prior periods, dividend payments
were a significant use of capital resources. The Verizon Board of Directors
determines the appropriateness of the level of our dividend payments
on a periodic basis by considering such factors as long-term growth
opportunities, internal cash requirements and the expectations of our
shareowners. During the third quarter of 2010, the Board increased our
quarterly dividend payment 2.6% to $.4875 per share from $.475 per share
in the same period of 2009. During the third quarter of 2009 and 2008,
the Board increased our dividend payments 3.3% and 7.0%, respectively.
Common Stock
Common stock has been used from time to time to satisfy some of the
funding requirements of employee and shareowner plans.
On February 3, 2011, the Board of Directors replaced the current share
buyback program with a new program for the repurchase of up to 100
million common shares terminating no later than the close of business on
February 28, 2014. The Board also determined that no additional shares
were to be purchased under the prior program.
During the first quarter of 2009, we entered into a privately negotiated
prepaid forward agreement for 14 million shares of Verizon common
stock at a cost of approximately $0.4 billion. We terminated the prepaid
forward agreement with respect to 5 million of the shares during the
fourth quarter of 2009 and 9 million of the shares in the first quarter of
2010, which resulted in the delivery of those shares to Verizon.
There were no repurchases of common stock during 2010 and 2009.
During 2008, we repurchased $1.4 billion of our common stock.