Verizon Wireless 2010 Annual Report Download - page 26
Download and view the complete annual report
Please find page 26 of the 2010 Verizon Wireless annual report below. You can navigate through the pages in the report by either clicking on the pages listed below, or by using the keyword search tool below to find specific information within the annual report.-
 1
1 -
2
-
3
-
4
-
5
-
6
-
7
-
8
-
9
-
10
-
11
-
12
-
13
-
14
-
15
-
 16
16 -
 17
17 -
 18
18 -
 19
19 -
 20
20 -
 21
21 -
 22
22 -
 23
23 -
 24
24 -
 25
25 -
 26
26 -
 27
27 -
 28
28 -
 29
29 -
 30
30 -
 31
31 -
 32
32 -
 33
33 -
 34
34 -
 35
35 -
 36
36 -
37
-
38
-
39
-
40
-
41
-
42
-
43
-
44
-
45
-
46
-
47
-
48
-
49
-
50
-
51
-
52
-
53
-
54
-
55
-
56
-
57
-
58
-
59
-
60
-
61
-
62
-
63
-
64
-
65
-
66
-
67
-
68
-
69
-
70
-
71
-
72
-
73
-
74
-
75
-
76
-
77
-
78
-
79
-
80
 |
 |

24
Management’sDiscussionandAnalysis
ofFinancialConditionandResultsofOperations – As Adjusted continued
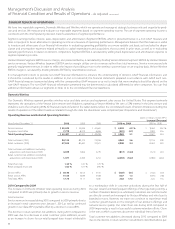
Operating Expenses
(dollars in millions)
Increase/(Decrease)
Years Ended December 31, 2010 2009 2008 2010 vs. 2009 2009 vs. 2008
Cost of services and sales $ 19,245 $ 19,348 $ 15,660 $ (103) (0.5)% $ 3,688 23.6 %
Selling, general and administrative expense 18,082 17,309 14,273 773 4.5 3,036 21.3
Depreciation and amortization expense 7,356 7,030 5,405 326 4.6 1,625 30.1
Total Operating Expenses $ 44,683 $ 43,687 $ 35,338 $ 996 2.3 $ 8,349 23.6
Cost of Services and Sales
Cost of services and sales decreased during 2010 compared to 2009
due to a decrease in the cost of equipment sales, partially offset by an
increase in cost of services. Cost of equipment sales decreased by $0.6
billion primarily due to both a decrease in retail customer gross addi-
tions and cost reduction initiatives, partially offset by an increase in the
average cost per unit. Cost of services increased due to higher wireless
network costs driven by increases in local interconnection cost, as a result
of both higher capacity needs from increases in data usage as well as
costs incurred to transition to Ethernet facilities that will be used to sup-
port the LTE network. In addition, the increase in costs of services was
impacted by higher roaming costs as a result of increased international
roaming volumes, data roaming and roaming costs incurred in the Alltel
Divestiture Markets, partially offset by synergies from moving traffic to our
own network. Also contributing to higher wireless network costs during
2010 compared to 2009 was an increase in operating lease expense
related to our network cell sites.
Cost of services and sales increased during 2009 compared to 2008
primarily due to higher wireless network costs including the effects of
operating an expanded wireless network as a result of the acquisition of
Alltel. This increase included network usage for voice and data services,
use of data services and applications such as e-mail and messaging pro-
vided by third party vendors, operating lease expense related to a larger
number of cell sites, as well as salary and benefits as a result of an increase
in network-related headcount. These increases were partially offset by a
decrease in roaming costs that was realized primarily by moving more
traffic to our own network as a result of the acquisition of Alltel. Cost
of equipment increased by $2.1 billion primarily due to the increase in
the number of both data and phone equipment units sold as well as an
increase in the average cost per equipment unit.
Selling, General and Administrative Expense
Selling, general and administrative expense increased during 2010
compared to 2009 primarily due to an increase in sales commission
expense in our indirect channel, as well as increases in other general and
administrative expenses, partially offset by a decrease in advertising and
promotional costs. Indirect sales commission expense increased $0.8
billion during 2010 compared to 2009 as a result of increases in both
the average commission per unit, as the mix of units continues to shift
toward data devices and more customers activate data service, and in
contract renewals in connection with equipment upgrades. Other gen-
eral and administrative expenses such as billing and data processing
charges, non-income taxes, and bad debt expense increased primarily as
a result of the growth of our customer base. Advertising and promotional
costs decreased $0.2 billion during 2010 compared to 2009 primarily due
to reductions in media spending.
Selling, general and administrative expense increased during 2009
compared to 2008 primarily due to a $0.9 billion increase in salary and
benefits as a result of a larger employee base after the acquisition of
Alltel, as well as an $0.8 billion increase in sales commission expense, pri-
marily in our indirect channel as a result of increases in both equipment
upgrades leading to contract renewals and customer gross additions, as
well as an increase in the average commission per unit. We also expe-
rienced increases in other selling, general and administrative expenses
primarily as a result of supporting a larger customer base as a result of
our acquisition of Alltel.
Depreciation and Amortization Expense
Depreciation and amortization expense increased during 2010 compared
to 2009 primarily driven by growth in depreciable assets. Depreciation
and amortization expense increased during 2009 compared to 2008 pri-
marily driven by depreciable property and equipment and finite-lived
intangible assets acquired from Alltel, including its customer lists, as well
as growth in depreciable assets during 2009.
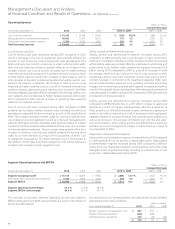
Segment Operating Income and EBITDA
(dollars in millions)
Increase/(Decrease)
Years Ended December 31, 2010 2009 2008 2010 vs. 2009 2009 vs. 2008
Segment Operating Income $ 18,724 $ 16,638 $ 13,960 $ 2,086 12.5 % $ 2,678 19.2 %
Add Depreciation and amortization expense 7,356 7,030 5,405 326 4.6 1,625 30.1
Segment EBITDA $ 26,080 $ 23,668 $ 19,365 $ 2,412 10.2 $ 4,303 22.2
Segment operating income margin 29.5 % 27.6 % 28.3 %
Segment EBITDA service margin 46.9 % 45.5 % 45.5 %
The increases in DomesticWireless’ Operating income and Segment
EBITDA during 2010 and 2009, were primarily as a result of the impact of
factors described above.
Non-recurringornon-operationalitemsexcludedfromDomesticWireless’
Operating income were as follows:
(dollars in millions)
Years Ended December 31, 2010 2009 2008
Merger integration and acquisition costs $ 867 $ 954 $ –
Impact of divested operations (348) (789) –
Deferred revenue adjustment 235 (78) (34)
$ 754 $ 87 $ (34)