Verizon Wireless 2010 Annual Report Download - page 4
Download and view the complete annual report
Please find page 4 of the 2010 Verizon Wireless annual report below. You can navigate through the pages in the report by either clicking on the pages listed below, or by using the keyword search tool below to find specific information within the annual report.-
 1
1 -
 2
2 -
 3
3 -
 4
4 -
 5
5 -
 6
6 -
 7
7 -
 8
8 -
 9
9 -
 10
10 -
 11
11 -
 12
12 -
 13
13 -
 14
14 -
 15
15 -
16
-
17
-
18
-
19
-
20
-
21
-
22
-
23
-
24
-
25
-
26
-
27
-
28
-
29
-
30
-
31
-
32
-
33
-
34
-
35
-
36
-
37
-
38
-
39
-
40
-
41
-
42
-
43
-
44
-
45
-
46
-
47
-
48
-
49
-
50
-
51
-
52
-
53
-
54
-
55
-
56
-
57
-
58
-
59
-
60
-
61
-
62
-
63
-
64
-
65
-
66
-
67
-
68
-
69
-
70
-
71
-
72
-
73
-
74
-
75
-
76
-
77
-
78
-
79
-
80
 |
 |

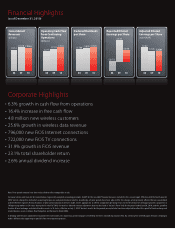
Our results in 2010 reflect the fundamental strength of our company. Revenues grew 1.9
percent on a comparable basis for the year, the second straight year of positive revenue growth in
a very sluggish economy. Our growth was propelled by strong performance in wireless, broadband
and strategic business services, and our results improved in the second half of the year, giving us
good momentum entering 2011. Our cash-flow performance was particularly strong in 2010. We
generated $33.4 billion in operating cash flow and grew free cash flow by 16.4 percent. Combined
with the proceeds from our sale of some non-strategic assets, this enabled us to invest $16.5 billion
in our advanced networks, pay $5.4 billion in dividends and reduce net debt by $14.1 billion. The
Board of Directors showed its confidence in future cash flows by voting in September to raise our
dividend by 2.6 percent – the fourth increase in as many years – to $1.95 a share on an annual
basis. We also completed the spin-off of some rural telephone properties to Frontier, which yielded
$1.85 per share in value for shareowners.
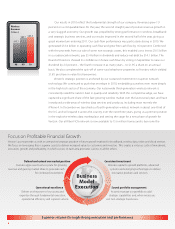
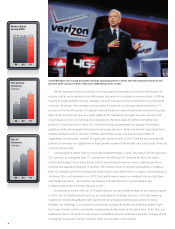
Verizon’s strategic position is anchored by our sustained investment in superior network
technology. We continued to push that envelope in 2010, embedding ourselves even more deeply
in the high-tech sector of the economy. Our nationwide third-generation wireless network is
consistently rated the nation’s best in quality and reliability. With this competitive edge, we have
captured a significant share of the fast-growing wireless market over the last several years and have
introduced a wide array of wireless data services and products, including most recently the
iPhone 4. In December we launched our fourth-generation wireless network in about one-third of
the U.S. and will expand it across the country over the next three years, giving us a premier position
in the explosive wireless data marketplace and setting the stage for a new phase of growth for
Verizon. Our all-fiber FiOS network is now available to 15.6 million homes and is bar none the
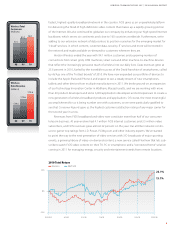
$49.3
$60.3 $63.4
Wireless
Revenue
(billions)
08 09 10
Focus on Profitable Financial Growth
Verizon’s assets provide us with an unmatched strategic position in future growth markets for broadband, wireless data, video and cloud services.
We focus on leveraging these superior assets to deliver increased value to customers and investors. This creates a virtuous cycle of investment,
execution, growth and profitability, in which success in each area promotes success in all the others.
Superior returns through strong execution and performance
Consistent investment
Allocate capital to growth platforms, advanced
systems and emerging technologies to deliver
innovative products and services.
Sound portfolio management
Actively manage our portfolio to add
strategic capabilities and, when necessary,
exit non-strategic businesses..
Operational excellence
Deliver on the power of our assets and
expertise through fundamental execution,
operational efficiency and superior service.
Defend and extend our market position
Execute aggressive business plans for growing
revenue and gaining market share to generate cash
for continued investment. Business
Model
Execution
22