Verizon Wireless 2010 Annual Report Download - page 29
Download and view the complete annual report
Please find page 29 of the 2010 Verizon Wireless annual report below. You can navigate through the pages in the report by either clicking on the pages listed below, or by using the keyword search tool below to find specific information within the annual report.-
 1
1 -
2
-
3
-
4
-
5
-
6
-
7
-
8
-
9
-
10
-
11
-
12
-
13
-
14
-
15
-
16
-
17
-
18
-
 19
19 -
 20
20 -
 21
21 -
 22
22 -
 23
23 -
 24
24 -
 25
25 -
 26
26 -
 27
27 -
 28
28 -
 29
29 -
 30
30 -
 31
31 -
 32
32 -
 33
33 -
 34
34 -
 35
35 -
 36
36 -
 37
37 -
 38
38 -
 39
39 -
40
-
41
-
42
-
43
-
44
-
45
-
46
-
47
-
48
-
49
-
50
-
51
-
52
-
53
-
54
-
55
-
56
-
57
-
58
-
59
-
60
-
61
-
62
-
63
-
64
-
65
-
66
-
67
-
68
-
69
-
70
-
71
-
72
-
73
-
74
-
75
-
76
-
77
-
78
-
79
-
80
 |
 |

27
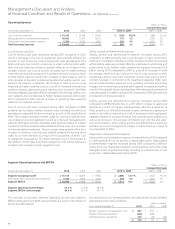
Operating Expenses
(dollars in millions)
Increase (Decrease)
Years Ended December 31, 2010 2009 2008 2010 vs. 2009 2009 vs. 2008
Cost of services and sales $ 22,618 $ 22,693 $ 22,890 $ (75) (0.3)% $ (197) (0.9) %
Selling, general and administrative expense 9,372 9,947 10,169 (575) (5.8) (222) (2.2)
Depreciation and amortization expense 8,469 8,238 8,174 231 2.8 64 0.8
Total Operating Expenses $ 40,459 $ 40,878 $ 41,233 $ (419) (1.0) $ (355) (0.9)
Management’sDiscussionandAnalysis
ofFinancialConditionandResultsofOperations – As Adjusted continued
Selling, General and Administrative Expense
Selling, general and administrative expense decreased during 2010 com-
pared to 2009 primarily due to the decline in compensation expense as
a result of lower headcount and cost reduction initiatives, partially offset
by higher gains on sales of assets in 2009. Selling, general and administra-
tive expense in 2009 decreased compared to 2008 primarily due to the
decline in compensation expense as a result of lower headcount and cost
reduction initiatives, as well as favorable foreign exchange movements.
Depreciation and Amortization Expense
Depreciation and amortization expense increased during 2010 com-
pared to 2009 due to growth in depreciable telephone plant from capital
spending. Depreciation and amortization expense in 2009 increased com-
pared to 2008 primarily driven by growth in depreciable telephone plant
from capital spending, partially offset by lower rates of depreciation as a
result of changes in the estimated useful lives of certain asset classes.
Cost of Services and Sales
Cost of services and sales were essentially unchanged during 2010
compared to 2009. Decreases were primarily due to lower costs associ-
ated with compensation and installation expenses as a result of lower
headcount and productivity improvements, as well as lower access costs
driven mainly by management actions to reduce exposure to unprofit-
able international wholesale routes and declines in overall wholesale long
distance volumes. In addition, our FiOS TV and Internet cost of acquisition
per addition also decreased in 2010 compared to 2009. These declines
were partially offset by higher customer premise equipment costs and
content costs associated with continued FiOS subscriber growth. Our
FiOS TV and FiOS Internet cost of acquisition per addition also decreased
in 2010 compared to 2009.
Cost of services and sales in 2009 decreased compared to 2008, primarily
due to lower costs associated with compensation, installation, repair and
maintenance expenses as a result of fewer access lines, lower headcount
and productivity improvements. Also contributing to the decreases were
lower long distance MOUs and customer premise equipment costs, as
well as favorable foreign exchange movements. Partially offsetting these
decreases were higher content and customer acquisition costs associated
with continued subscriber growth. Our FiOS TV and FiOS Internet cost of
acquisition per addition also decreased in 2009 compared to 2008.
Segment Operating Income and EBITDA
(dollars in millions)
Increase/(Decrease)
Years Ended December 31, 2010 2009 2008 2010 vs. 2009 2009 vs. 2008
Segment Operating Income $ 768 $ 1,573 $ 3,090 $ (805) (51.2)% $ (1,517) (49.1)%
Add Depreciation and amortization expense 8,469 8,238 8,174 231 2.8 64 0.8
Segment EBITDA $ 9,237 $ 9,811 $ 11,264 $ (574) (5.9) $ (1,453) (12.9)
Segment operating income margin 1.9% 3.7% 7.0%
Segment EBITDA margin 22.4% 23.1% 25.4%
ThedecreasesinWireline’sOperatingincomeandSegmentEBITDAduring
2010 and 2009 were primarily a result of the impact of factors described in
connection with operating revenue and operating expenses above.
Non-recurring or non-operational items excluded from Wireline’s
Operating income were as follows:
(dollars in millions)
Years Ended December 31, 2010 2009 2008
Severance, pension and benefit charges $ 2,237 $ 2,253 $ 506
Access line spin-off and other charges 79 51 34
Merger integration costs – – 151
Impact of divested operations (408) (980) (1,197)
$ 1,908 $ 1,324 $ (506)