Verizon Wireless 2010 Annual Report Download - page 31
Download and view the complete annual report
Please find page 31 of the 2010 Verizon Wireless annual report below. You can navigate through the pages in the report by either clicking on the pages listed below, or by using the keyword search tool below to find specific information within the annual report.-
 1
1 -
2
-
3
-
4
-
5
-
6
-
7
-
8
-
9
-
10
-
11
-
12
-
13
-
14
-
15
-
16
-
17
-
18
-
19
-
20
-
 21
21 -
 22
22 -
 23
23 -
 24
24 -
 25
25 -
 26
26 -
 27
27 -
 28
28 -
 29
29 -
 30
30 -
 31
31 -
 32
32 -
 33
33 -
 34
34 -
 35
35 -
 36
36 -
 37
37 -
 38
38 -
 39
39 -
 40
40 -
 41
41 -
42
-
43
-
44
-
45
-
46
-
47
-
48
-
49
-
50
-
51
-
52
-
53
-
54
-
55
-
56
-
57
-
58
-
59
-
60
-
61
-
62
-
63
-
64
-
65
-
66
-
67
-
68
-
69
-
70
-
71
-
72
-
73
-
74
-
75
-
76
-
77
-
78
-
79
-
80
 |
 |

29
Management’sDiscussionandAnalysis
ofFinancialConditionandResultsofOperations – As Adjusted continued
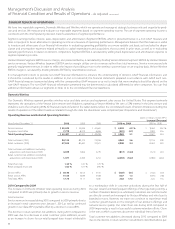
Cash Flows From Investing Activities
Capital Expenditures
Capital expenditures continue to be our primary use of capital resources
as they facilitate the introduction of new products and services, enhance
responsiveness to competitive challenges and increase the operating
efficiency and productivity of our networks. We are directing our capital
spending primarily toward higher growth markets.
Capital expenditures, including capitalized software, were as follows:
(dollars in millions)
Years Ended December 31, 2010 2009 2008
Domestic Wireless $ 8,438 $ 7,152 $ 6,510
Wireline 7,269 8,892 9,797
Other 751 828 826
$ 16,458 $ 16,872 $ 17,133
Total as a percentage of total revenue 15.4% 15.7% 17.6%
During 2010, we continued to focus on increasing our return on capital
expenditures by shifting capital more towards investing in the capacity
of our wireless EV-DO networks and funding the build-out of our 4G LTE
network. Accordingly, during 2010, capital expenditures at Domestic
Wireless increased nearly $1.3 billion compared to 2009. The increase in
capital expenditures at Domestic Wireless were more than offset by the
decrease in capital expenditures at Wireline during 2010 compared to
2009 primarily due to lower capital expenditures related to FiOS.
The increase in capital expenditures at Domestic Wireless during 2009
compared to 2008 was primarily due to the incremental capital spending
on the acquired Alltel properties, continued investment in our wireless
EV-DO networks, and funding the development of our 4G LTE network.
The decrease in capital expenditures at Wireline during 2009 was primarily
due to the FiOS deployment plan, which included larger expenditures in
2008, as well as lower legacy spending requirements.
Dispositions
During 2010, we received cash proceeds of $2.6 billion in connection
with the required divestitures of overlapping properties as a result of the
acquisitionofAlltel(see“AcquisitionsandDivestitures”).
Acquisitions
During 2010, 2009 and 2008, we invested $1.4 billion, $6.0 billion and
$15.9 billion, respectively, in acquisitions of licenses, investments and
businesses.See“OtherConsolidatedResults”fortheamountsofinterest
paid that were capitalized during 2010, 2009 and 2008.
• On August 23, 2010, Verizon Wireless acquired the net assets and
related customers of six operating markets in Louisiana and Mississippi
in a transaction with AT&T Inc. for cash consideration of $0.2 billion.
• On January 9, 2009,VerizonWireless paid approximately $5.9 billion
for the equity of Alltel, which was partially offset by $1.0 billion of cash
acquired at closing.
• During2008,VerizonWirelesswasthewinningbidderin theFederal
CommunicationsCommission’s(FCC)auctionofspectruminthe700
MHz band and paid the FCC $9.4 billion to acquire 109 licenses in the
700 MHz band.
• OnAugust7,2008,VerizonWirelesscompleteditsacquisitionofRural
Cellular for cash consideration of $0.9 billion, net of cash acquired and
after an exchange transaction with another carrier to complete the
required divestiture of certain markets.
• OnJune10,2008,inconnectionwiththeannouncementoftheAlltel
transaction, Verizon Wireless purchased approximately $5.0 billion
aggregate principal amount of debt obligations of Alltel for approxi-
mately $4.8 billion plus accrued and unpaid interest.
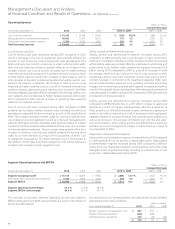
CONSOLIDATED FINANCIAL CONDITION
(dollars in millions)
Years Ended December 31, 2010 2009 2008
Cash Flows Provided By (Used In)
Operating activities $ 33,363 $ 31,390 $ 27,452
Investing activities (15,054) (23,156) (31,474)
Financing activities (13,650) (16,007) 12,651
Increase (Decrease) In Cash and
Cash Equivalents $ 4,659 $ (7,773) $ 8,629
We use the net cash generated from our operations to fund network
expansion and modernization, repay external financing, pay dividends,
repurchase Verizon common stock from time to time and invest in new
businesses. While our current liabilities typically exceed current assets, our
sources of funds, primarily from operations and, to the extent necessary,
from external financing arrangements, are sufficient to meet ongoing
operating and investing requirements. We expect that our capital
spending requirements will continue to be financed primarily through
internally generated funds. Debt or equity financing may be needed to
fund additional development activities or to maintain our capital struc-
ture to ensure our financial flexibility.
We manage our capital structure to balance our cost of capital and the
need for financial flexibility. We believe that we will continue to have the
necessary access to capital markets.
Our available external financing arrangements include the issuance of
commercial paper, credit available under credit facilities and other bank
lines of credit, vendor financing arrangements, issuances of registered
debt or equity securities and privately-placed capital market securities. We
currently have a shelf registration available for the issuance of up to $4.0
billion of additional unsecured debt or equity securities. We may also issue
short-term debt through an active commercial paper program and have a
$6.2 billion credit facility to support such commercial paper issuances.
Cash Flows From Operating Activities
Our primary source of funds continues to be cash generated from opera-
tions. Net cash provided by operating activities during 2010 increased
by $2.0 billion compared to 2009 primarily due to higher operating cash
flows at Domestic Wireless, changes in working capital related in part to
management of inventory and the timing of tax payments. Partially off-
setting these increases were lower operating cash flows at Wireline, as
well as a lower net distribution from Vodafone Omnitel.
Net cash provided by operating activities in 2009 increased by $3.9
billion compared to the similar period in 2008 primarily driven by higher
operating cash flows at Domestic Wireless resulting from the acquisition
of Alltel, as well as a higher net distribution from Vodafone Omnitel.
Partially offsetting the increase in net cash provided by operating activities
were payments totaling $0.5 billion to settle the acquired Alltel interest
rate swaps.