Verizon Wireless 2010 Annual Report Download - page 71
Download and view the complete annual report
Please find page 71 of the 2010 Verizon Wireless annual report below. You can navigate through the pages in the report by either clicking on the pages listed below, or by using the keyword search tool below to find specific information within the annual report.-
 1
1 -
2
-
3
-
4
-
5
-
6
-
7
-
8
-
9
-
10
-
11
-
12
-
13
-
14
-
15
-
16
-
17
-
18
-
19
-
20
-
21
-
22
-
23
-
24
-
25
-
26
-
27
-
28
-
29
-
30
-
31
-
32
-
33
-
34
-
35
-
36
-
37
-
38
-
39
-
40
-
41
-
42
-
43
-
44
-
45
-
46
-
47
-
48
-
49
-
50
-
51
-
52
-
53
-
54
-
55
-
56
-
57
-
58
-
59
-
60
-
 61
61 -
 62
62 -
 63
63 -
 64
64 -
 65
65 -
 66
66 -
 67
67 -
 68
68 -
 69
69 -
 70
70 -
 71
71 -
 72
72 -
 73
73 -
 74
74 -
 75
75 -
 76
76 -
 77
77 -
 78
78 -
 79
79 -
 80
80
 |
 |

Notes to Consolidated Financial Statements continued
69
NOTE 14
SEGMENT INFORMATION
Reportable Segments
We have two reportable segments, which we operate and manage as
strategic business units and organize by products and services. We mea-
sure and evaluate our reportable segments based on segment operating
income, consistent with the chief operating decision maker’s assessment
of segment performance.
Corporate, eliminations and other includes unallocated corporate
expenses, intersegment eliminations recorded in consolidation, the
results of other businesses, such as our investments in unconsolidated
businesses, pension and other employee benefit related costs, lease
financing, as well as the historical results of divested operations and other
adjustments and gains and losses that are not allocated in assessing seg-
ment performance due to their non-operational nature. Although such
transactions are excluded from the business segment results, they are
included in reported consolidated earnings. Gains and losses that are not
individually significant are included in all segment results as these items
are included in the chief operating decision maker’s assessment of seg-
ment performance.
The reconciliation of segment operating revenues and expenses to con-
solidated operating revenues and expenses below also includes those
items of a non-recurring or non-operational nature. We exclude from
segment results the effects of certain items that management does not
consider in assessing segment performance, primarily because of their
non-recurring non-operational nature.
During the fourth quarter of 2010, Verizon changed its method of
accounting for benefit plans as described in Note 1, as a result, all prior
periods have been adjusted. As part of this change to its method of
accounting, the service cost and the amortization of prior service costs,
which are representative of the benefits earned by active employees
during the period, will continue to be allocated to the segment in which
the employee is employed, while interest cost and expected return on
assets will now be recorded at the Corporate level. The recognition of
actuarial gains and losses will also be recorded at the Corporate level.
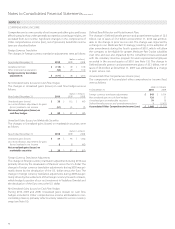
The following table provides operating financial information for our two reportable segments:
(dollars in millions)
2010 Domestic Wireless Wireline Total Segments
External Operating Revenues
Service revenue $ 55,588 $ – $ 55,588
Equipment and other 7,753 – 7,753
Mass Markets – 16,247 16,247
Global Enterprise – 15,667 15,667
Global Wholesale – 7,173 7,173
Other – 858 858
Intersegment revenues 66 1,282 1,348
Total operating revenues 63,407 41,227 104,634
Cost of services and sales 19,245 22,618 41,863
Selling, general and administrative expense 18,082 9,372 27,454
Depreciation and amortization expense 7,356 8,469 15,825
Total operating expenses 44,683 40,459 85,142
Operating income $ 18,724 $ 768 $ 19,492
Assets $ 138,863 $ 83,849 $ 222,712
Plant, property and equipment, net 32,253 54,594 86,847
Capital expenditures 8,438 7,269 15,707
In order to comply with regulatory conditions related to the acquisition
of Alltel in January 2009, Verizon Wireless divested overlapping proper-
ties in 105 operating markets in 24 states during the first half of 2010.
In addition, on July 1, 2010, certain of Verizon’s local exchange business
and related landline activities in 14 states were spun off (see Note 3).
Furthermore, in 2008, we completed the spin-off of our local exchange
and related business assets in Maine, New Hampshire and Vermont.
Accordingly, the historical Domestic Wireless and Wireline results for
these operations have been reclassified to Corporate and Other to reflect
comparable segment operating results.
We have adjusted prior-period consolidated and segment information,
where applicable, to conform to current year presentation.
Our segments and their principal activities consist of the following:
Segment Description
Domestic Wireless Domestic Wireless’ communications products and
services include wireless voice and data services and
equipment sales across the U.S.
Wireline Wireline’s communications products and services
include voice, Internet access, broadband video and
data, Internet protocol network services, network
access, long distance and other services. We provide
these products and services to consumers in the U.S.,
as well as to carriers, businesses and government
customers both in the U.S. and in over 150 other
countries around the world.