Verizon Wireless 2010 Annual Report Download - page 28
Download and view the complete annual report
Please find page 28 of the 2010 Verizon Wireless annual report below. You can navigate through the pages in the report by either clicking on the pages listed below, or by using the keyword search tool below to find specific information within the annual report.-
 1
1 -
2
-
3
-
4
-
5
-
6
-
7
-
8
-
9
-
10
-
11
-
12
-
13
-
14
-
15
-
16
-
17
-
 18
18 -
 19
19 -
 20
20 -
 21
21 -
 22
22 -
 23
23 -
 24
24 -
 25
25 -
 26
26 -
 27
27 -
 28
28 -
 29
29 -
 30
30 -
 31
31 -
 32
32 -
 33
33 -
 34
34 -
 35
35 -
 36
36 -
 37
37 -
 38
38 -
39
-
40
-
41
-
42
-
43
-
44
-
45
-
46
-
47
-
48
-
49
-
50
-
51
-
52
-
53
-
54
-
55
-
56
-
57
-
58
-
59
-
60
-
61
-
62
-
63
-
64
-
65
-
66
-
67
-
68
-
69
-
70
-
71
-
72
-
73
-
74
-
75
-
76
-
77
-
78
-
79
-
80
 |
 |
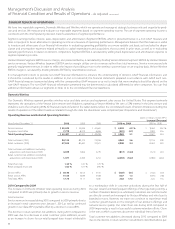
26
billion, or 6.3%, during 2010 compared to 2009 primarily due to higher
information technology, security solution and strategic networking rev-
enues.StrategicenterpriseservicescontinuestobeGlobalEnterprise’s
fastest growing suite of offerings. Traditional circuit-based services such
as frame relay, private line and ATM services declined compared to the
similar period last year as our customer base continues its migration to
next generation IP services.
2009 Compared to 2008
The decrease in Global Enterprise revenues during 2009 compared to
2008 was primarily due to lower long distance and traditional circuit based
data revenues and lower customer premises equipment revenue, com-
bined with the negative effect of movements in foreign exchange rates
versus the U.S. dollar. The decline in long distance revenue was driven
by a 2.2% decline in MOUs compared to 2008, due to global economic
conditions and competitive rate pressures, which adversely impacted our
business customers. Traditional circuit based services such as frame relay,
private line and ATM services declined compared to the similar period in
2008 as our customer base continued its migration to next generation
IP services. Customer premises equipment revenue decreased approxi-
mately 6.7% compared to 2008 reflecting cautious investment decisions
in the marketplace in response to the uncertain economic environment.
Partially offsetting these declines was an increase of 14.6% in IP and secu-
rity solutions revenues. Strategic enterprise services revenue increased
4.9% in 2009 compared to 2008.
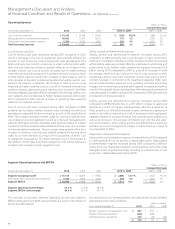
Global Wholesale
Global Wholesale revenues are primarily earned from long distance and
other carriers who use our facilities to provide services to their customers.
Switched access revenues are generated from fixed and usage-based
charges paid by carriers for access to our local network, interexchange
wholesale traffic sold in the United States, as well as internationally des-
tined traffic that originates in the United States. Special access revenues
are generated from carriers that buy dedicated local exchange capacity
to support their private networks. Wholesale services also include local
wholesale revenues from unbundled network elements and intercon-
nection revenues from competitive local exchange carriers and wireless
carriers. A portion of Global Wholesale revenues are generated by a few
large telecommunication companies, many of whom compete directly
with us.
2010 Compared to 2009
The decrease in Global Wholesale revenues during 2010 compared to
2009 was primarily due to decreased MOUs in traditional voice prod-
ucts, increases in voice termination pricing on certain international
routes, which negatively impacted volume, and continued rate com-
pression due to competition in the marketplace. Switched access and
interexchange wholesale MOUs declined primarily as a result of wireless
substitution and access line losses. Domestic wholesale lines declined by
9.0% as of December 31, 2010 compared to December 31, 2009 due to
the continued impact of competitors deemphasizing their local market
initiatives coupled with the impact of technology substitution, as well as
the continued level of economic pressure. Voice and local loop services
declined during 2010 compared to 2009. Continuing demand for high-
capacity, high-speed digital services was partially offset by lower demand
for older, low-speed data products and services. As of December 31, 2010,
customer demand, as measured in DS1 and DS3 circuits, for high-capacity
and high-speed digital data services increased 4.6% compared to 2009.
Management’sDiscussionandAnalysis
ofFinancialConditionandResultsofOperations – As Adjusted continued
2009 Compared to 2008
The decrease in Global Wholesale revenues during 2009 compared to
2008 was primarily due to decreased MOUs in traditional voice products,
and continued rate compression due to competition in the marketplace.
Switched access and interexchange wholesale MOUs declined primarily
as a result of wireless substitution and access line losses. Wholesale lines
declined by 21.1% in 2009 due to the continued impact of competitors
deemphasizing their local market initiatives coupled with the impact of
technology substitution as well as the continued level of economic pres-
sure compared to a 20.1% decline in 2008. Changes in foreign exchange
rates resulted in a revenue decline of approximately 1.0% in 2009 com-
pared to 2008. Continuing demand for high-capacity, high-speed digital
services was partially offset by lower demand for older, low-speed data
products and services. As of December 31, 2009, customer demand, as
measured in DS1 and DS3 circuits, for high-capacity and digital data ser-
vices increased 2.2% compared to an increase of 5.1% in 2008.
The FCC regulates the rates charged to customers for interstate access
services.See“OtherFactorsThatMayAffectFutureResults–Regulatory
andCompetitiveTrends–FCCRegulation”foradditionalinformationon
FCC rulemaking concerning federal access rates, universal service and
certain broadband services.
Other Revenues
Other revenues include such services as local exchange and long dis-
tance services from former MCI mass market customers, operator
services, pay phone, card services and supply sales. The decrease in rev-
enues from other services during 2010 compared to 2009 was primarily
due to reduced business volumes, including former MCI mass market
customer losses.
The decrease in revenues from other services during 2009 compared to
2008 was mainly due to the discontinuation of non-strategic product
lines and reduced business volumes, including former MCI mass market
customer losses.