Verizon Wireless 2010 Annual Report Download - page 75
Download and view the complete annual report
Please find page 75 of the 2010 Verizon Wireless annual report below. You can navigate through the pages in the report by either clicking on the pages listed below, or by using the keyword search tool below to find specific information within the annual report.-
 1
1 -
2
-
3
-
4
-
5
-
6
-
7
-
8
-
9
-
10
-
11
-
12
-
13
-
14
-
15
-
16
-
17
-
18
-
19
-
20
-
21
-
22
-
23
-
24
-
25
-
26
-
27
-
28
-
29
-
30
-
31
-
32
-
33
-
34
-
35
-
36
-
37
-
38
-
39
-
40
-
41
-
42
-
43
-
44
-
45
-
46
-
47
-
48
-
49
-
50
-
51
-
52
-
53
-
54
-
55
-
56
-
57
-
58
-
59
-
60
-
61
-
62
-
63
-
64
-
 65
65 -
 66
66 -
 67
67 -
 68
68 -
 69
69 -
 70
70 -
 71
71 -
 72
72 -
 73
73 -
 74
74 -
 75
75 -
 76
76 -
 77
77 -
 78
78 -
 79
79 -
 80
80
 |
 |

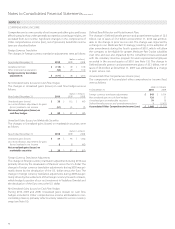
Notes to Consolidated Financial Statements continued
73
NOTE 16
ADDITIONAL FINANCIAL INFORMATION
The tables that follow provide additional financial information related to our consolidated financial statements:
Income Statement Information
(dollars in millions)
Years Ended December 31, 2010 2009 2008
Depreciation expense $ 14,593 $ 14,564 $ 13,227
Interest incurred 3,487 4,029 2,566
Interest capitalized (964) (927) (747)
Advertising expense 2,451 3,020 2,754
Balance Sheet Information
(dollars in millions)
December 31, 2010 2009
Accounts Payable and Accrued Liabilities
Accounts payable $ 3,936 $ 4,337
Accrued expenses 4,110 3,486
Accrued vacation, salaries and wages 5,686 5,084
Interest payable 813 872
Taxes payable 1,157 1,444
$ 15,702 $ 15,223
Other Current Liabilities
Advance billings and customer deposits $ 3,091 $ 2,644
Dividends payable 1,402 1,372
Other 2,860 2,692
$ 7,353 $ 6,708
Cash Flow Information
(dollars in millions)
Years Ended December 31, 2010 2009 2008
Cash Paid
Income taxes, net of amounts refunded $ 430 $ 158 $ 1,206
Interest, net of amounts capitalized 2,433 2,573 1,664