Verizon Wireless 2010 Annual Report Download - page 24
Download and view the complete annual report
Please find page 24 of the 2010 Verizon Wireless annual report below. You can navigate through the pages in the report by either clicking on the pages listed below, or by using the keyword search tool below to find specific information within the annual report.-
 1
1 -
2
-
3
-
4
-
5
-
6
-
7
-
8
-
9
-
10
-
11
-
12
-
13
-
 14
14 -
 15
15 -
 16
16 -
 17
17 -
 18
18 -
 19
19 -
 20
20 -
 21
21 -
 22
22 -
 23
23 -
 24
24 -
 25
25 -
 26
26 -
 27
27 -
 28
28 -
 29
29 -
 30
30 -
 31
31 -
 32
32 -
 33
33 -
 34
34 -
35
-
36
-
37
-
38
-
39
-
40
-
41
-
42
-
43
-
44
-
45
-
46
-
47
-
48
-
49
-
50
-
51
-
52
-
53
-
54
-
55
-
56
-
57
-
58
-
59
-
60
-
61
-
62
-
63
-
64
-
65
-
66
-
67
-
68
-
69
-
70
-
71
-
72
-
73
-
74
-
75
-
76
-
77
-
78
-
79
-
80
 |
 |

22
Management’sDiscussionandAnalysis
ofFinancialConditionandResultsofOperations – As Adjusted continued
SEGMENT RESULTS OF OPERATIONS
We have two reportable segments, Domestic Wireless and Wireline, which we operate and manage as strategic business units and organize by prod-
ucts and services. We measure and evaluate our reportable segments based on segment operating income. The use of segment operating income is
consistentwiththechiefoperatingdecisionmaker’sassessmentofsegmentperformance.
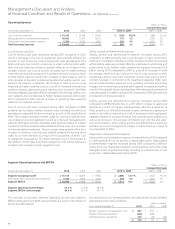
Segment earnings before interest, taxes, depreciation and amortization (Segment EBITDA), which is presented below, is a non-GAAP measure and
does not purport to be an alternative to operating income as a measure of operating performance. Management believes that this measure is useful
to investors and other users of our financial information in evaluating operating profitability on a more variable cost basis, as it excludes the depre-
ciation and amortization expenses related primarily to capital expenditures and acquisitions that occurred in prior years, as well as in evaluating
operatingperformanceinrelationtoVerizon’scompetitors.SegmentEBITDAiscalculatedbyaddingbackdepreciationandamortizationexpenseto
segment operating income.
Verizon Wireless Segment EBITDA service margin, also presented below, is calculated by dividing Verizon Wireless Segment EBITDA by Verizon Wireless
service revenues. Verizon Wireless Segment EBITDA service margin utilizes service revenues rather than total revenues. Service revenues exclude
primarily equipment revenues in order to reflect the impact of providing service to the wireless customer base on an ongoing basis. Verizon Wireline
EBITDA margin is calculated by dividing Wireline EBITDA by total Wireline revenues.
Itismanagement’sintenttoprovidenon-GAAPfinancialinformationtoenhancetheunderstandingofVerizon’sGAAPfinancialinformation,and
it should be considered by the reader in addition to, but not instead of, the financial statements prepared in accordance with GAAP. Each non-
GAAP financial measure is presented along with the corresponding GAAP measure so as not to imply that more emphasis should be placed on the
non-GAAP measure. The non-GAAP financial information presented may be determined or calculated differently by other companies. You can find
additional information about our segments in Note 14 to the consolidated financial statements.
Domestic Wireless
Our Domestic Wireless segment provides wireless voice and data services and equipment sales across the United States. This segment primarily
represents the operations of the Verizon joint venture with Vodafone, operating as Verizon Wireless. We own a 55% interest in the joint venture and
Vodafone owns the remaining 45%. All financial results included in the tables below reflect the consolidated results of Verizon Wireless excluding the
resultsofoperationsoftheAlltelDivestitureMarketsthroughthedatethedivestitureswerecompleted(see“AcquisitionsandDivestitures”).
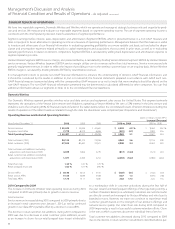
Operating Revenue and Selected Operating Statistics
(dollarsinmillions,exceptARPU)
Increase/(Decrease)
Years Ended December 31, 2010 2009 2008 2010 vs. 2009 2009 vs. 2008
Service revenue $ 55,629 $ 52,046 $ 42,602 $ 3,583 6.9 % $ 9,444 22.2 %
Equipment and other 7,778 8,279 6,696 (501) (6.1) 1,583 23.6
Total Operating Revenue $ 63,407 $ 60,325 $ 49,298 $ 3,082 5.1 $ 11,027 22.4
Total customers ('000) 94,135 89,172 72,056 4,963 5.6 17,116 23.8
Retailcustomers('000) 87,535 85,445 70,021 2,090 2.4 15,424 22.0
Total customer net additions (excluding
acquisitions and divestitures) ('000) 4,839 5,656 5,779 (817) (14.4) (123) (2.1)
Retailcustomernetadditions(excluding
acquisitions and divestitures) ('000) 1,977 4,369 5,752 (2,392) (54.7) (1,383) (24.0)
Total churn rate 1.33 % 1.41 % 1.25 %
Retailpostpaidchurnrate 1.02 % 1.07 % 0.96 %
ServiceARPU $ 50.46 $ 50.53 $ 51.55 $ (0.07) (0.1) $ (1.02) (2.0)
RetailserviceARPU 51.56 50.89 51.84 0.67 1.3 (0.95) (1.8)
TotaldataARPU 17.73 15.11 12.85 2.62 17.3 2.26 17.6
2010 Compared to 2009
TheincreaseinDomesticWireless’totaloperatingrevenueduring2010
compared to 2009 was primarily due to growth in service revenue.
Service revenue
Service revenue increased during 2010 compared to 2009 primarily due to
an increase in total customers since January 1, 2010, as well as continued
growthinourdataARPU,partiallyoffsetbyadeclineinvoiceARPU.
The decline in retail customer net additions during 2010 compared to
2009 was due to a decrease in retail customer gross additions, as well
as an increase in churn for our retail prepaid base in part attributable
to a marketplace shift in customer activations during the first half of
the year toward unlimited prepaid offerings of the type being sold by a
numberofresellers.Retail(non-wholesale)customersarecustomerswho
are directly served and managed by Verizon Wireless and who buy its
branded services. However, we expect to continue to experience retail
customer growth based on the strength of our product offerings and
network service quality. Our total churn rate during 2010 compared to
2009 improved as a result of successful customer retention efforts. Churn
is the rate at which customers disconnect individual lines of service.
Total customer net additions decreased during 2010 compared to 2009
due to the decline in retail customer net additions described above par-