Verizon Wireless 2010 Annual Report Download - page 27
Download and view the complete annual report
Please find page 27 of the 2010 Verizon Wireless annual report below. You can navigate through the pages in the report by either clicking on the pages listed below, or by using the keyword search tool below to find specific information within the annual report.-
 1
1 -
2
-
3
-
4
-
5
-
6
-
7
-
8
-
9
-
10
-
11
-
12
-
13
-
14
-
15
-
16
-
 17
17 -
 18
18 -
 19
19 -
 20
20 -
 21
21 -
 22
22 -
 23
23 -
 24
24 -
 25
25 -
 26
26 -
 27
27 -
 28
28 -
 29
29 -
 30
30 -
 31
31 -
 32
32 -
 33
33 -
 34
34 -
 35
35 -
 36
36 -
 37
37 -
38
-
39
-
40
-
41
-
42
-
43
-
44
-
45
-
46
-
47
-
48
-
49
-
50
-
51
-
52
-
53
-
54
-
55
-
56
-
57
-
58
-
59
-
60
-
61
-
62
-
63
-
64
-
65
-
66
-
67
-
68
-
69
-
70
-
71
-
72
-
73
-
74
-
75
-
76
-
77
-
78
-
79
-
80
 |
 |

25
Mass Markets
Mass Markets revenue includes local exchange (basic service and end-
user access), long distance (including regional toll), broadband services
(including high-speed Internet and FiOS Internet) and FiOS TV services
for residential and small business subscribers.
2010 Compared to 2009
The increase in Mass Markets revenue during 2010 compared to 2009
was primarily driven by the expansion of consumer and business FiOS
services (Voice, Internet and TV), which are typically sold in bundles,
partially offset by the decline of local exchange revenues principally as
a result of a decline in switched access lines as of December 31, 2010
compared to December 31, 2009, primarily as a result of competition and
technology substitution. The majority of the decrease was sustained in
the residential retail market, which experienced a 9.0% access line loss
primarily due to substituting traditional landline services with wireless,
VoIP, broadband and cable services. Also contributing to the decrease
was a decline of nearly 5.0% in small business retail access lines, primarily
reflecting economic conditions, competition and a shift to both IP and
high-speed circuits.
As we continue to expand the number of premises eligible to order FiOS
services and extend our sales and marketing efforts to attract new FiOS
subscribers, we have continued to grow our subscriber base and con-
sistently improved penetration rates within our FiOS service areas. Our
bundled pricing strategy allows us to provide competitive offerings to
our customers and potential customers. As of December 31, 2010, we
achieved penetration rates of 31.9% and 28.0% for FiOS Internet and FiOS
TV, respectively, compared to penetration rates of 28.3% and 24.7% for
FiOS Internet and FiOS TV, respectively, at December 31, 2009.
2009 Compared to 2008
The increase in Mass Markets revenue during 2009 compared to 2008
was primarily driven by the expansion of FiOS services (Voice, Internet
and TV), partially offset by a decline in local exchange revenues princi-
pally due to a decline in switched access lines as of December 31, 2009
compared to December 31, 2008, primarily as a result of competition and
technology substitution. The majority of the decrease was sustained in
the residential retail market, which experienced a 10.5% access line loss
primarily due to substituting traditional landline services with wireless,
VoIP, broadband and cable services. Also contributing to the decrease
was a decline of nearly 6.2% in small business retail access lines, primarily
reflecting economic conditions, competition and a shift to both IP and
high-speed circuits.
As of December 31, 2009, we achieved penetration rates of 28.3% and
24.7% for FiOS Internet and FiOS TV, respectively, compared to penetra-
tion rates of 25.1% and 21.1% for FiOS Internet and FiOS TV, respectively,
at December 31, 2008.
Global Enterprise
Global Enterprise offers voice, data and Internet communications services
to medium and large business customers, multinational corporations,
and state and federal government customers. In addition to traditional
voice and data services, Global Enterprise offers managed and advanced
products and solutions including IP services and value-added solutions
that make communications more secure, reliable and efficient. Global
Enterprise also provides managed network services for customers that
outsource all or portions of their communications and information pro-
cessing operations and data services such as private IP, private line, frame
relay and asynchronous transfer mode (ATM) services, both domestically
and internationally. In addition, Global Enterprise offers professional ser-
vices in more than 30 countries supporting a range of solutions including
network service, managing a move to IP-based unified communications
and providing application performance support.
2010 Compared to 2009
Global Enterprise revenues were essentially unchanged during 2010
compared to 2009. Higher customer premises equipment and strategic
networking revenues, were offset by lower local services and traditional
circuit-based revenues. The increase in customer premises equipment and
strategic networking revenue may indicate that companies are beginning
to increase capital expenditures. Long distance revenues declined due
to negative effects of the continuing global economic conditions and
competitive rate pressures. In addition to increased customer premise
equipment revenues, strategic enterprise services revenue increased $0.4
Management’sDiscussionandAnalysis
ofFinancialConditionandResultsofOperations – As Adjusted continued
Wireline
The Wireline segment provides customers with communication products and services, including voice, broadband video and data, network access,
long distance, and other services, to residential and small business customers and carriers, as well as next-generation IP network services and com-
munications solutions to medium and large businesses and government customers globally.
The following discussion reflects the impact related to the change in accounting for benefit plans (see Note 1 to the consolidated financial state-
ments).Reclassificationshavebeenmadetoreflectcomparableoperatingresultsforthespin-offoftheoperationsintheFrontiertransaction,which
we owned through June 30, 2010, and the spin-off of the local exchange business and related landline activities in Maine, New Hampshire and
Vermont,whichwascompletedonMarch31,2008(see“AcquisitionsandDivestitures”).
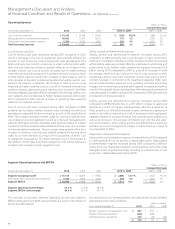
Operating Revenues and Selected Operating Statistics
(dollars in millions)
Increase/(Decrease)
Years Ended December 31, 2010 2009 2008 2010 vs. 2009 2009 vs. 2008
Mass Markets $ 16,256 $ 16,115 $ 15,831 $ 141 0.9 % $ 284 1.8 %
Global Enterprise 15,669 15,667 16,601 2 – (934) (5.6)
Global Wholesale 8,393 9,155 9,832 (762) (8.3) (677) (6.9)
Other 909 1,514 2,059 (605) (40.0) (545) (26.5)
Total Operating Revenues $ 41,227 $ 42,451 $ 44,323 $ (1,224) (2.9) $ (1,872) (4.2)
Switched access lines in service ('000) 26,001 28,323 31,370 (2,322) (8.2) (3,047) (9.7)
Broadband connections ('000) 8,392 8,160 7,676 232 2.8 484 6.3
FiOS Internet subscribers ('000) 4,082 3,286 2,371 796 24.2 915 38.6
FiOS TV subscribers ('000) 3,472 2,750 1,849 722 26.3 901 48.7