Verizon Wireless 2010 Annual Report Download - page 20
Download and view the complete annual report
Please find page 20 of the 2010 Verizon Wireless annual report below. You can navigate through the pages in the report by either clicking on the pages listed below, or by using the keyword search tool below to find specific information within the annual report.-
 1
1 -
2
-
3
-
4
-
5
-
6
-
7
-
8
-
9
-
 10
10 -
 11
11 -
 12
12 -
 13
13 -
 14
14 -
 15
15 -
 16
16 -
 17
17 -
 18
18 -
 19
19 -
 20
20 -
 21
21 -
 22
22 -
 23
23 -
 24
24 -
 25
25 -
 26
26 -
 27
27 -
 28
28 -
 29
29 -
 30
30 -
31
-
32
-
33
-
34
-
35
-
36
-
37
-
38
-
39
-
40
-
41
-
42
-
43
-
44
-
45
-
46
-
47
-
48
-
49
-
50
-
51
-
52
-
53
-
54
-
55
-
56
-
57
-
58
-
59
-
60
-
61
-
62
-
63
-
64
-
65
-
66
-
67
-
68
-
69
-
70
-
71
-
72
-
73
-
74
-
75
-
76
-
77
-
78
-
79
-
80
 |
 |

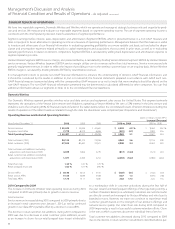
2009 Compared to 2008
The increase in Consolidated revenues in 2009 compared to the similar
period in 2008 was primarily due to the inclusion of the operating results
of Alltel in our Wireless segment and higher revenues in our growth mar-
kets. These revenue increases were partially offset by declines in revenues
at our Wireline segment due to switched access line losses and decreased
MOUs in traditional voice products.
TheincreaseinDomesticWireless’revenuesin2009comparedtothe
similar period in 2008 was primarily due to the inclusion of the operating
results of Alltel and continued growth in service revenue. Service revenue
in 2009 increased compared to the similar period in 2008 primarily due to
an increase in net new customers, after conforming adjustments, which
we acquired in connection with the acquisition of Alltel on January 9,
2009, as well as an increase in total customers from sources other than
acquisitions. Total data revenue was $15.6 billion and accounted for
29.9% of service revenue in 2009, compared to $10.6 billion and 24.9%,
respectively, during the similar period in 2008 because of increased use
of Mobile Broadband, e-mail, and messaging.
DomesticWireless’equipmentandotherrevenueincreasedduring2009
compared to the similar period in 2008 primarily due to an increase in
the number of units sold, partially offset by a decrease in the average rev-
enue per unit. Other revenues increased primarily due to the inclusion of
the operating results of Alltel and an increase in our cost recovery rate.
2010 Compared to 2009
Cost of Services and Sales
Cost of services and sales includes the following costs directly attribut-
able to a service or product: salaries and wages, benefits, materials and
supplies, contracted services, network access and transport costs, wire-
less equipment costs, customer provisioning costs, computer systems
support, costs to support our outsourcing contracts and technical facili-
ties and contributions to the Universal Service Fund. Aggregate customer
care costs, which include billing and service provisioning, are allocated
between Cost of services and sales and Selling, general and administra-
tive expense.
Cost of services and sales decreased during 2010 compared to 2009 pri-
marily due to the sale of the divested operations, lower headcount and
productivity improvements at our Wireline and Domestic Wireless seg-
ments, partially offset by higher severance, pension and benefit charges
recorded during 2010 and other non-operational charges noted in the
table below as well as higher customer premise equipment and content
costs. In addition, lower access costs at Wireline were primarily driven by
management actions to reduce exposure to unprofitable international
wholesale routes. Our FiOS TV and Internet cost of acquisition per addi-
tion also decreased in 2010 compared to 2009. Wireless network costs
also increased as a result of an increase in local interconnection cost and
increases in roaming costs.
18
Management’sDiscussionandAnalysis
ofFinancialConditionandResultsofOperations – As Adjusted continued
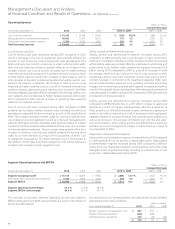
Consolidated Operating Expenses
(dollars in millions)
Increase/(Decrease)
Years Ended December 31, 2010 2009 2008 2010 vs. 2009 2009 vs. 2008
Cost of services and sales $ 44,149 $ 44,579 $ 38,615 $ (430) (1.0)% $ 5,964 15.4 %
Selling, general and administrative expense 31,366 30,717 41,517 649 2.1 (10,800) (26.0)
Depreciation and amortization expense 16,405 16,534 14,610 (129) (0.8) 1,924 13.2
Consolidated Operating Expenses $ 91,920 $ 91,830 $ 94,742 $ 90 0.1 $ (2,912) (3.1)
ThedecreaseinWireline’srevenuesin2009comparedto2008waspri-
marily driven by declines in Global Enterprise, Global Wholesale and
Other revenue, partially offset by an increase in Mass Markets revenue.
The decrease in Global Enterprise revenues in 2009 compared to the
similar period in 2008 was primarily due to lower long distance and
traditional circuit-based data revenues, and lower customer premise
equipment combined with the negative effects of movements in foreign
exchange rates versus the U.S. dollar. This decrease was partially offset
by an increase in IP, managed network solutions and security solutions
revenues. The decrease in Global Wholesale revenues in 2009 compared
to the similar period in 2008 was primarily due to decreased MOUs in
traditional voice products and continued rate compression due to com-
petition in the marketplace. The decrease in revenues from other services
during 2009 compared to 2008 was mainly due to the discontinuation
of non-strategic product lines and reduced business volumes, including
former MCI mass market customer losses. The increase in Mass Markets
revenue in 2009 compared to the similar period in 2008 was primarily
driven by the expansion of FiOS services (Voice, Internet and TV), partially
offset by a decline in local exchange revenues principally due to switched
access line losses.
Consolidated operating expenses increased during 2010 compared to
2009 primarily due to increased expenses at Domestic Wireless as well as
higher severance, pension and benefit charges. Consolidated operating
expenses in 2010 were favorably impacted by the sale of divested opera-
tions and cost reduction initiatives at Wireline and Domestic Wireless.
Consolidated operating expenses decreased during 2009 compared to
2008 primarily due to lower severance, pension and benefit charges,
partially offset by increased expenses at Wireless, in part due to the acqui-
sition of Alltel.
Severance, pension and benefit charges during 2010, 2009 and 2008
included pension settlement losses and remeasurement (gains) losses of
$0.6 billion, ($1.4 billion) and $15.0 billion, respectively. See Note 1 to the
consolidated financial statements regarding the change in accounting
for benefit plans.