Verizon Wireless 2010 Annual Report Download - page 66
Download and view the complete annual report
Please find page 66 of the 2010 Verizon Wireless annual report below. You can navigate through the pages in the report by either clicking on the pages listed below, or by using the keyword search tool below to find specific information within the annual report.-
 1
1 -
2
-
3
-
4
-
5
-
6
-
7
-
8
-
9
-
10
-
11
-
12
-
13
-
14
-
15
-
16
-
17
-
18
-
19
-
20
-
21
-
22
-
23
-
24
-
25
-
26
-
27
-
28
-
29
-
30
-
31
-
32
-
33
-
34
-
35
-
36
-
37
-
38
-
39
-
40
-
41
-
42
-
43
-
44
-
45
-
46
-
47
-
48
-
49
-
50
-
51
-
52
-
53
-
54
-
55
-
 56
56 -
 57
57 -
 58
58 -
 59
59 -
 60
60 -
 61
61 -
 62
62 -
 63
63 -
 64
64 -
 65
65 -
 66
66 -
 67
67 -
 68
68 -
 69
69 -
 70
70 -
 71
71 -
 72
72 -
 73
73 -
 74
74 -
 75
75 -
 76
76 -
77
-
78
-
79
-
80
 |
 |

Notes to Consolidated Financial Statements continued
64
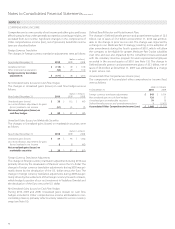
The assumed Health Care Cost Trend Rates follow:
Health Care and Life
At December 31, 2010 2009 2008
Healthcare cost trend rate assumed
for next year 7.75% 8.00% 9.00%
Rate to which cost trend rate
gradually declines 5.00 5.00 5.00
Year the rate reaches level it is assumed to
remain thereafter 2016 2014 2014
A one-percentage-point change in the assumed health care cost trend
rate would have the following effects:
(dollars in millions)
One-Percentage-Point Increase Decrease
Effect on 2010 service and interest cost $ 232 $ (191)
Effect on postretirement benefit obligation as of
December 31, 2010 2,788 (2,303)
Plan Assets
Our portfolio strategy emphasizes a long-term equity orientation, signifi-
cant global diversification, the use of both public and private investments
and financial and operational risk controls. Our diversification and risk
control processes serve to minimize the concentration of risk. Assets are
allocated according to long-term risk and return estimates. Both active
and passive management approaches are used depending on perceived
market efficiencies and various other factors.
While target allocation percentages will vary over time, the company’s
overall investment strategy is to achieve a mix of assets, which allows us
to meet projected benefits payments while taking into consideration risk
and return. The target allocations for plan assets are currently 46% public
equity, 32% fixed income, 14% private equity, 6% real estate and 2% cash.
Our target policies are revisited periodically to ensure they are in line with
fund objectives. There are no significant concentrations of risk, in terms of
sector, industry, geography or company names.
Pension and healthcare and life plans assets include Verizon common
stock of $0.1 billion at December 31, 2010 and 2009.
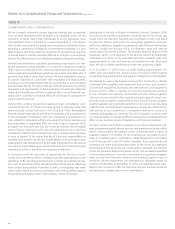
Pension Plans
The fair values for the pension plans by asset category at December 31,
2010 are as follows:
(dollars in millions)
Asset Category Total Level 1 Level 2 Level 3
Cash and cash equivalents $ 2,175 $ 2,126 $ 49 $ –
Equity securities 10,158 9,052 1,106 –
Fixed income securities
U.S. Treasuries and agencies 599 141 458 –
Corporate bonds 1,615 233 1,202 180
International bonds 910 20 890 –
Other 502 – 502 –
Real estate 1,769 – – 1,769
Other
Private equity 5,889 – 40 5,849
Hedge funds 2,197 – 1,481 716
Total $ 25,814 $ 11,572 $ 5,728 $ 8,514
The fair values for the pension plans by asset category at December 31,
2009 are as follows:
(dollars in millions)
Asset Category Total Level 1 Level 2 Level 3
Cash and cash equivalents $ 2,299 $ 2,288 $ 11 $ –
Equity securities 12,691 11,533 1,158 –
Fixed income securities
U.S. Treasuries and agencies 1,095 428 667 –
Corporate bonds 2,531 73 2,321 137
International bonds 1,112 768 344 –
Other 646 – 646 –
Real estate 1,541 – – 1,541
Other
Private equity 5,362 – 26 5,336
Hedge funds 1,315 – 1,315 –
Total $ 28,592 $ 15,090 $ 6,488 $ 7,014