Verizon Wireless 2010 Annual Report Download - page 72
Download and view the complete annual report
Please find page 72 of the 2010 Verizon Wireless annual report below. You can navigate through the pages in the report by either clicking on the pages listed below, or by using the keyword search tool below to find specific information within the annual report.-
 1
1 -
2
-
3
-
4
-
5
-
6
-
7
-
8
-
9
-
10
-
11
-
12
-
13
-
14
-
15
-
16
-
17
-
18
-
19
-
20
-
21
-
22
-
23
-
24
-
25
-
26
-
27
-
28
-
29
-
30
-
31
-
32
-
33
-
34
-
35
-
36
-
37
-
38
-
39
-
40
-
41
-
42
-
43
-
44
-
45
-
46
-
47
-
48
-
49
-
50
-
51
-
52
-
53
-
54
-
55
-
56
-
57
-
58
-
59
-
60
-
61
-
 62
62 -
 63
63 -
 64
64 -
 65
65 -
 66
66 -
 67
67 -
 68
68 -
 69
69 -
 70
70 -
 71
71 -
 72
72 -
 73
73 -
 74
74 -
 75
75 -
 76
76 -
 77
77 -
 78
78 -
 79
79 -
 80
80
 |
 |

70
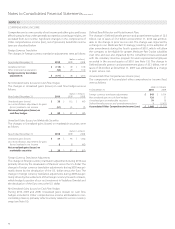
Notes to Consolidated Financial Statements continued
(dollars in millions)
2009 Domestic Wireless Wireline Total Segments
External Operating Revenues
Service revenue $ 51,975 $ – $ 51,975
Equipment and other 8,250 – 8,250
Mass Markets – 16,109 16,109
Global Enterprise – 15,666 15,666
Global Wholesale – 7,958 7,958
Other – 1,443 1,443
Intersegment revenues 100 1,275 1,375
Total operating revenues 60,325 42,451 102,776
Cost of services and sales 19,348 22,693 42,041
Selling, general and administrative expense 17,309 9,947 27,256
Depreciation and amortization expense 7,030 8,238 15,268
Total operating expenses 43,687 40,878 84,565
Operating income $ 16,638 $ 1,573 $ 18,211
Assets $ 135,162 $ 91,778 $ 226,940
Plant, property and equipment, net 30,849 59,373 90,222
Capital expenditures 7,152 8,892 16,044
(dollars in millions)
2008 Domestic Wireless Wireline Total Segments
External Operating Revenues
Service revenue $ 42,527 $ – $ 42,527
Equipment and other 6,665 – 6,665
Mass Markets – 15,823 15,823
Global Enterprise – 16,599 16,599
Global Wholesale – 8,770 8,770
Other – 1,959 1,959
Intersegment revenues 106 1,172 1,278
Total operating revenues 49,298 44,323 93,621
Cost of services and sales 15,660 22,890 38,550
Selling, general and administrative expense 14,273 10,169 24,442
Depreciation and amortization expense 5,405 8,174 13,579
Total operating expenses 35,338 41,233 76,571
Operating income $ 13,960 $ 3,090 $ 17,050
Assets $ 111,979 $ 90,386 $ 202,365
Plant, property and equipment, net 27,136 58,287 85,423
Capital expenditures 6,510 9,797 16,307