Windstream 2008 Annual Report Download - page 101
Download and view the complete annual report
Please find page 101 of the 2008 Windstream annual report below. You can navigate through the pages in the report by either clicking on the pages listed below, or by using the keyword search tool below to find specific information within the annual report.-
 1
1 -
2
-
3
-
4
-
5
-
6
-
7
-
8
-
9
-
10
-
11
-
12
-
13
-
14
-
15
-
16
-
17
-
18
-
19
-
20
-
21
-
22
-
23
-
24
-
25
-
26
-
27
-
28
-
29
-
30
-
31
-
32
-
33
-
34
-
35
-
36
-
37
-
38
-
39
-
40
-
41
-
42
-
43
-
44
-
45
-
46
-
47
-
48
-
49
-
50
-
51
-
52
-
53
-
54
-
55
-
56
-
57
-
58
-
59
-
60
-
61
-
62
-
63
-
64
-
65
-
66
-
67
-
68
-
69
-
70
-
71
-
72
-
73
-
74
-
75
-
76
-
77
-
78
-
79
-
80
-
81
-
82
-
83
-
84
-
85
-
86
-
87
-
88
-
89
-
90
-
 91
91 -
 92
92 -
 93
93 -
 94
94 -
 95
95 -
 96
96 -
 97
97 -
 98
98 -
 99
99 -
 100
100 -
 101
101 -
 102
102 -
 103
103 -
 104
104 -
 105
105 -
 106
106 -
 107
107 -
 108
108 -
 109
109 -
 110
110 -
 111
111 -
112
-
113
-
114
-
115
-
116
-
117
-
118
-
119
-
120
-
121
-
122
-
123
-
124
-
125
-
126
-
127
-
128
-
129
-
130
-
131
-
132
-
133
-
134
-
135
-
136
-
137
-
138
-
139
-
140
-
141
-
142
-
143
-
144
-
145
-
146
-
147
-
148
-
149
-
150
-
151
-
152
-
153
-
154
-
155
-
156
-
157
-
158
-
159
-
160
-
161
-
162
-
163
-
164
-
165
-
166
-
167
-
168
-
169
-
170
-
171
-
172
-
173
-
174
-
175
-
176
-
177
-
178
-
179
-
180
 |
 |

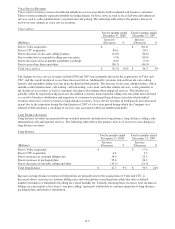
with high-speed Internet-capable modems as costs of products sold during the fourth quarter of 2006, resulting in a
decrease in cost of services in 2007.
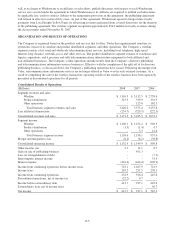
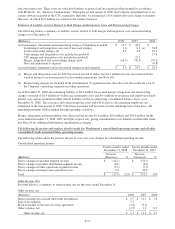
Cost of Products Sold
Cost of products sold represent the cost of equipment sales to customers, including sales of high-speed Internet
modems and customer premise equipment, as well as sales of computers to residential high-speed Internet customers.
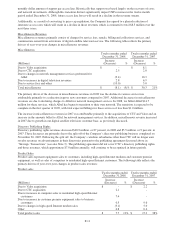
The following table reflects the primary drivers of year-over-year changes in cost of product sold:
Cost of products sold
Twelve months ended
December 31, 2008
Twelve months ended
December 31, 2007
(Millions)
Increase
(Decrease) %
Increase
(Decrease) %
Due to Valor acquisition $ - $ 1.3
Due to CTC acquisition 2.9 1.0
Due to increases in computer sales to residential high-speed Internet
customers 10.9 -
Due to changes in high-speed Internet modem sales (0.2) 11.7
Other 6.8 3.9
Total cost of products sold $ 20.4 40% $ 17.9 55%
Cost of products sold increased in 2008 primarily due to costs associated with computer sales to residential customers
to promote the Company’s high-speed Internet services, as previously discussed. Gross margin on product sales
decreased $12.7 million and $0.7 million in 2008 and 2007, respectively. The decrease in 2008 gross margin was
primarily due to losses incurred on its computer sales. The increase in cost of products sold in 2007 was primarily due
to costs associated with sales of high-speed Internet-capable modems. The increase in costs associated with high-speed
Internet capable modems is primarily due to the change in classification of these costs from cost of services to costs of
products sold in the fourth quarter of 2006, as previously discussed. Increases in cost of products sold are also due in
part to the acquisitions of CTC and Valor.
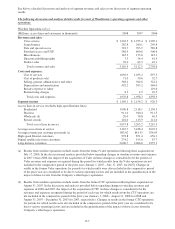
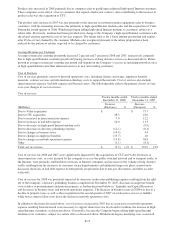
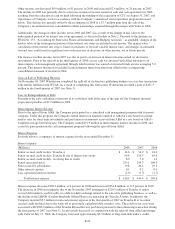
Selling, General, Administrative and Other Expenses (“SG&A”)
SG&A expenses result from sales and marketing efforts, advertising, information technology support systems, costs
associated with corporate and other support functions, and professional fees. These expenses also include salaries and
wages and employee benefits not directly associated with the provision of services. The following table reflects the
primary drivers of year-over-year changes in SG&A expenses:
Selling, general, administrative and other expenses
Twelve months ended
December 31, 2008
Twelve months ended
December 31, 2007
(Millions)
Increase
(Decrease) %
Increase
(Decrease) %
Due to Valor acquisition $ - $ 20.5
Due to CTC acquisition 13.9 5.2
Due to impairment loss on acquired assets held for sale 6.5 -
Due to changes in advertising and distribution expense (0.1) 22.3
Due to decreases in information technology costs (8.7) (1.9)
Due to decreases in general and administrative expense and other (8.0) (3.5)
Total selling, general, administrative and other expenses $ 3.6 1% $ 42.6 13%
Increases in SG&A expenses in both years are primarily due to the acquisitions of Valor and CTC. In addition, in the
third quarter of 2008, Windstream recognized a $6.5 million non-cash impairment charge to adjust the carrying value
of the Company’s Wireless Communications Services and 39 GHz fixed wireless spectrum holdings to their estimated
fair value. The fair market value of these assets has been reduced to a nominal amount due to an impairment resulting
from general market conditions as well as limited interest on this bandwidth of spectrum.
Partially offsetting the increases in 2008 were declines due to the realignment of the Company’s information
technology services functions during the first quarter of 2007, as discussed further below. Additionally, general and
administrative expenses decreased in 2008 due to the decline in insurance costs resulting from improved claims
experience and the Company’s continued cost containment efforts.
F-13