Windstream 2008 Annual Report Download - page 99
Download and view the complete annual report
Please find page 99 of the 2008 Windstream annual report below. You can navigate through the pages in the report by either clicking on the pages listed below, or by using the keyword search tool below to find specific information within the annual report.-
 1
1 -
2
-
3
-
4
-
5
-
6
-
7
-
8
-
9
-
10
-
11
-
12
-
13
-
14
-
15
-
16
-
17
-
18
-
19
-
20
-
21
-
22
-
23
-
24
-
25
-
26
-
27
-
28
-
29
-
30
-
31
-
32
-
33
-
34
-
35
-
36
-
37
-
38
-
39
-
40
-
41
-
42
-
43
-
44
-
45
-
46
-
47
-
48
-
49
-
50
-
51
-
52
-
53
-
54
-
55
-
56
-
57
-
58
-
59
-
60
-
61
-
62
-
63
-
64
-
65
-
66
-
67
-
68
-
69
-
70
-
71
-
72
-
73
-
74
-
75
-
76
-
77
-
78
-
79
-
80
-
81
-
82
-
83
-
84
-
85
-
86
-
87
-
88
-
 89
89 -
 90
90 -
 91
91 -
 92
92 -
 93
93 -
 94
94 -
 95
95 -
 96
96 -
 97
97 -
 98
98 -
 99
99 -
 100
100 -
 101
101 -
 102
102 -
 103
103 -
 104
104 -
 105
105 -
 106
106 -
 107
107 -
 108
108 -
 109
109 -
110
-
111
-
112
-
113
-
114
-
115
-
116
-
117
-
118
-
119
-
120
-
121
-
122
-
123
-
124
-
125
-
126
-
127
-
128
-
129
-
130
-
131
-
132
-
133
-
134
-
135
-
136
-
137
-
138
-
139
-
140
-
141
-
142
-
143
-
144
-
145
-
146
-
147
-
148
-
149
-
150
-
151
-
152
-
153
-
154
-
155
-
156
-
157
-
158
-
159
-
160
-
161
-
162
-
163
-
164
-
165
-
166
-
167
-
168
-
169
-
170
-
171
-
172
-
173
-
174
-
175
-
176
-
177
-
178
-
179
-
180
 |
 |

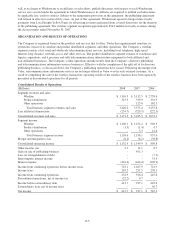
monthly dollar amount of support per access line. Historically that support was based largely on the recovery of costs
and network investments. Although this transition did not significantly impact USF revenues in the twelve month
period ended December 31, 2008, future access line losses will result in a decline in that revenue stream.
Additionally, as a result of converting to price-cap regulation, the Company has agreed to a phased reduction of
interstate access rates which will result in a decline in those revenues which is estimated to total $8.5 million over the
next three years.
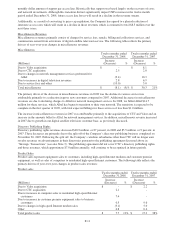
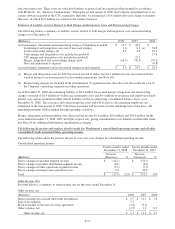
Miscellaneous Revenues
Miscellaneous revenues primarily consist of charges for service fees, rentals, billing and collections services, and
commissions earned from activations of digital satellite television service. The following table reflects the primary
drivers of year-over-year changes in miscellaneous revenues:
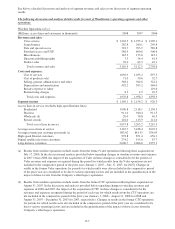
Miscellaneous
Twelve months ended
December 31, 2008
Twelve months ended
December 31, 2007
(Millions)
Increase
(Decrease) %
Increase
(Decrease) %
Due to Valor acquisition $ - $ 8.1
Due to CTC acquisition 2.5 2.0
Due to changes in network management services performed for
Alltel (3.4) 10.3
Due to increases in digital television revenues 2.8 6.9
Due to service fees and other (10.0) 3.0
Total miscellaneous $ (8.1) (5)% $ 30.3 21%
The primary driver of the decrease in miscellaneous revenues in 2008 was the decline in various service fees
attributable primarily to a reduction in gross new customers compared to 2007. Additional decreases in miscellaneous
revenues are due to declining charges to Alltel for network management services. In 2008, we billed Alltel $14.7
million for these services, which Alltel has begun to transition to their own network. The transition is expected to be
complete in the first quarter of 2009, with total expected billings for these services of less than $1.0 million.
The increase in miscellaneous revenues in 2007 was attributable primarily to the acquisitions of CTC and Valor and an
increase in the amounts billed to Alltel for network management services. In addition, miscellaneous revenue increased
in 2007 due to growth in our digital satellite television customer base, as previously discussed.
Directory Publishing Rights
Directory publishing rights revenues decreased $48.9 million, or 87 percent, in 2008 and $5.5 million, or 9 percent, in
2007. These decreases are primarily due to the split off of the Company’s directory publishing business completed on
November 30, 2007. Following the split off, the Company’s wireline subsidiaries other than CTC will no longer earn
royalty revenues on advertisements in their directories pursuant to the publishing agreement discussed above in
“Strategic Transactions” (see also Note 3). The publishing agreement did not cover CTC’s directory publishing rights,
and those revenues, which approximate $7.0 million annually, will continue to be recognized in future periods.
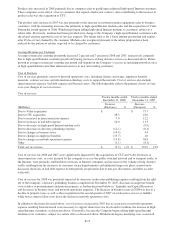
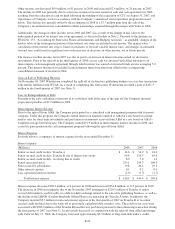
Product Sales
Product sales represent equipment sales to customers, including high-speed Internet modems and customer premise
equipment, as well as sales of computers to residential high-speed Internet customers. The following table reflects the
primary drivers of year-over-year changes in product sales revenues:
Product sales
Twelve months ended
December 31,2008
Twelve months ended
December 31, 2007
(Millions)
Increase
(Decrease) %
Increase
(Decrease) %
Due to Valor acquisition $ - $ 2.2
Due to CTC acquisition 2.1 -
Due to increases in computer sales to residential high-speed Internet
customers 7.4 -
Due to increases in customer premise equipment sales to business
customers 0.5 9.6
Due to changes in high-speed Internet modem sales (3.1) 5.0
Other 0.8 0.4
Total product sales $ 7.7 12% $ 17.2 38%
F-11