Windstream 2008 Annual Report Download - page 171
Download and view the complete annual report
Please find page 171 of the 2008 Windstream annual report below. You can navigate through the pages in the report by either clicking on the pages listed below, or by using the keyword search tool below to find specific information within the annual report.-
 1
1 -
2
-
3
-
4
-
5
-
6
-
7
-
8
-
9
-
10
-
11
-
12
-
13
-
14
-
15
-
16
-
17
-
18
-
19
-
20
-
21
-
22
-
23
-
24
-
25
-
26
-
27
-
28
-
29
-
30
-
31
-
32
-
33
-
34
-
35
-
36
-
37
-
38
-
39
-
40
-
41
-
42
-
43
-
44
-
45
-
46
-
47
-
48
-
49
-
50
-
51
-
52
-
53
-
54
-
55
-
56
-
57
-
58
-
59
-
60
-
61
-
62
-
63
-
64
-
65
-
66
-
67
-
68
-
69
-
70
-
71
-
72
-
73
-
74
-
75
-
76
-
77
-
78
-
79
-
80
-
81
-
82
-
83
-
84
-
85
-
86
-
87
-
88
-
89
-
90
-
91
-
92
-
93
-
94
-
95
-
96
-
97
-
98
-
99
-
100
-
101
-
102
-
103
-
104
-
105
-
106
-
107
-
108
-
109
-
110
-
111
-
112
-
113
-
114
-
115
-
116
-
117
-
118
-
119
-
120
-
121
-
122
-
123
-
124
-
125
-
126
-
127
-
128
-
129
-
130
-
131
-
132
-
133
-
134
-
135
-
136
-
137
-
138
-
139
-
140
-
141
-
142
-
143
-
144
-
145
-
146
-
147
-
148
-
149
-
150
-
151
-
152
-
153
-
154
-
155
-
156
-
157
-
158
-
159
-
160
-
 161
161 -
 162
162 -
 163
163 -
 164
164 -
 165
165 -
 166
166 -
 167
167 -
 168
168 -
 169
169 -
 170
170 -
 171
171 -
 172
172 -
 173
173 -
 174
174 -
 175
175 -
 176
176 -
 177
177 -
 178
178 -
 179
179 -
 180
180
 |
 |

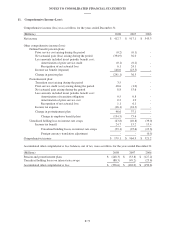
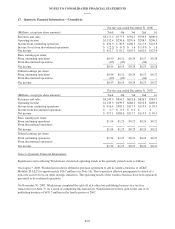
NOTES TO CONSOLIDATED FINANCIAL STATEMENTS
15. Supplemental Guarantor Information, Continued:
Condensed Consolidated Statement of Cash Flows
For the Year Ended December 31, 2008
(Millions) Parent Guarantors
Non-
Guarantors Eliminations Consolidated
Cash Provided from Operations:
Net income $ 412.7 $ 222.2 $ 548.4 $ (770.6) $ 412.7
Adjustments to reconcile net income to net cash
provided from operations:
Loss on sale of wireless business - - 21.3 - 21.3
Depreciation and amortization - 169.5 325.0 - 494.5
Provision for doubtful accounts - 6.9 31.8 - 38.7
Stock-based compensation expense 8.2 0.3 9.6 - 18.1
Pension and postretirement benefits expense 0.1 1.4 12.4 - 13.9
Equity in (earnings) losses from subsidiaries (701.3) (69.4) 0.1 770.6 -
Deferred taxes (24.0) 47.9 86.1 - 110.0
Other, net 12.3 (1.2) 7.0 - 18.1
Changes in operating assets and liabilities, net 761.9 (263.9) (544.9) - (46.9)
Net cash provided from operations 469.9 113.7 496.8 - 1,080.4
Cash Flows from Investing Activities:
Additions to property, plant and equipment - (79.3) (238.2) - (317.5)
Disposition of wireless business 56.7 - - - 56.7
Disposition of acquired assets held for sale - 17.8 - - 17.8
Other, net - 3.4 6.5 - 9.9
Net cash from (used in) investing activities 56.7 (58.1) (231.7) - (233.1)
Cash Flows from Financing Activities:
Dividends paid on common shares (445.2) - - - (445.2)
Dividends received from (paid to) subsidiaries 320.3 (53.7) (266.6) - -
Stock repurchase (200.3) - - - (200.3)
Repayment of debt (344.0) (0.3) (10.0) - (354.3)
Debt issued, net of issuance costs 380.0 - - - 380.0
Other, net (1.8) (1.8) 0.7 - (2.9)
Net cash used in financing activities (291.0) (55.8) (275.9) - (622.7)
Increase (decrease) in cash and cash equivalents 235.6 (0.2) (10.8) - 224.6
Cash and Cash Equivalents:
Beginning of period 47.2 1.2 23.6 - 72.0
End of period $ 282.8 $ 1.0 $ 12.8 $ - $ 296.6
F-83