Windstream 2008 Annual Report Download - page 98
Download and view the complete annual report
Please find page 98 of the 2008 Windstream annual report below. You can navigate through the pages in the report by either clicking on the pages listed below, or by using the keyword search tool below to find specific information within the annual report.-
 1
1 -
2
-
3
-
4
-
5
-
6
-
7
-
8
-
9
-
10
-
11
-
12
-
13
-
14
-
15
-
16
-
17
-
18
-
19
-
20
-
21
-
22
-
23
-
24
-
25
-
26
-
27
-
28
-
29
-
30
-
31
-
32
-
33
-
34
-
35
-
36
-
37
-
38
-
39
-
40
-
41
-
42
-
43
-
44
-
45
-
46
-
47
-
48
-
49
-
50
-
51
-
52
-
53
-
54
-
55
-
56
-
57
-
58
-
59
-
60
-
61
-
62
-
63
-
64
-
65
-
66
-
67
-
68
-
69
-
70
-
71
-
72
-
73
-
74
-
75
-
76
-
77
-
78
-
79
-
80
-
81
-
82
-
83
-
84
-
85
-
86
-
87
-
 88
88 -
 89
89 -
 90
90 -
 91
91 -
 92
92 -
 93
93 -
 94
94 -
 95
95 -
 96
96 -
 97
97 -
 98
98 -
 99
99 -
 100
100 -
 101
101 -
 102
102 -
 103
103 -
 104
104 -
 105
105 -
 106
106 -
 107
107 -
 108
108 -
109
-
110
-
111
-
112
-
113
-
114
-
115
-
116
-
117
-
118
-
119
-
120
-
121
-
122
-
123
-
124
-
125
-
126
-
127
-
128
-
129
-
130
-
131
-
132
-
133
-
134
-
135
-
136
-
137
-
138
-
139
-
140
-
141
-
142
-
143
-
144
-
145
-
146
-
147
-
148
-
149
-
150
-
151
-
152
-
153
-
154
-
155
-
156
-
157
-
158
-
159
-
160
-
161
-
162
-
163
-
164
-
165
-
166
-
167
-
168
-
169
-
170
-
171
-
172
-
173
-
174
-
175
-
176
-
177
-
178
-
179
-
180
 |
 |

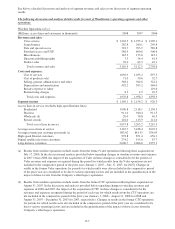
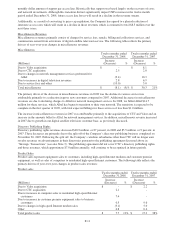
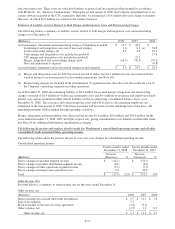
Data and Special Access Revenues
Data and special access revenues primarily consist of retail high-speed Internet services, the provision of virtual private
network, virtual LAN, and other next generation data services to business customers, and the provision of special
access services to wholesale customers. The following table reflects the primary drivers of year-over-year changes in
data and special access revenues:
Data and special access
Twelve months ended
December 31, 2008
Twelve months ended
December 31, 2007
(Millions)
Increase
(Decrease) %
Increase
(Decrease) %
Due to Valor acquisition $ - $ 49.4
Due to CTC acquisition 22.8 11.2
Due to increases in high-speed Internet customers 44.5 54.1
Due to increases in special access revenues 19.9 7.3
Due to increases in next generation data services 7.4 2.3
Other (3.8) (3.2)
Total data and special access $ 90.8 13% $ 121.1 21%
Increases in data and special access revenues in both periods are due in part to the acquisition of Valor and CTC as
well as the significant increase in high-speed Internet customers, as previously discussed. The remaining increases are
due to increases in special access revenues, which primarily represent monthly flat-rate end user charges for dedicated
circuits, and virtual networking services. Increases in special access revenues were primarily attributable to strong
demand from wireless and other carriers, while increases in next generation data services resulted from the introduction
of these services to new markets in both 2008 and 2007.
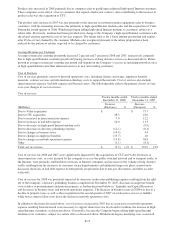
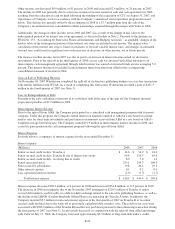
Switched Access and USF Revenues
Switched access and USF revenues include usage sensitive charges to long distance companies for access to the
Company’s network in connection with the completion of interstate and intrastate long distance calls, as well as
receipts from federal and state universal service funds that subsidize the cost of providing wireline services. The
following table reflects the primary drivers of year-over-year changes in switched access and USF revenues:
Switched access and USF
Twelve months ended
December 31, 2008
Twelve months ended
December 31, 2007
(Millions)
Increase
(Decrease) %
Increase
(Decrease) %
Due to Valor acquisition $ - $ 85.6
Due to CTC acquisition 19.0 12.2
Due to decreases in switched access revenues (25.9) (29.1)
Due to settlement of inter-carrier traffic dispute in 2007 (13.3) 13.3
Due to unfavorable state USF support assessment 7.3 (7.3)
Due to changes in federal USF support (2.5) 16.5
Other 1.5 3.0
Total switched access and USF $ (13.9) (2)% $ 94.2 19%
The changes in switched access and USF revenues in both periods were primarily due to the acquisitions of CTC and
Valor, decreases in switched access minutes and revenues associated with access line losses, as previously discussed,
the non-recurring favorable settlement in the second quarter of 2007 of an inter-carrier traffic dispute with another
carrier totaling $13.3 million, and the recognition of an unfavorable state USF assessment in the fourth quarter of 2007
totaling $7.3 million, as further discussed below under “State Regulation”.
In addition to these items, switched and USF revenues in 2007 were favorably impacted by an increase in federal USF
support primarily due to additional interstate common line support (“ICLS”) revenues resulting from increases in
recoverable costs.
As further discussed below in “Regulatory Matters – Wireline Operations”, effective July 1, 2008 the Company
converted the majority of its remaining interstate rate-of-return regulated operations to price-cap regulation. The
conversion to price-cap regulation resulted in the transition of support received under the ICLS program to a fixed
F-10