Windstream 2008 Annual Report Download - page 94
Download and view the complete annual report
Please find page 94 of the 2008 Windstream annual report below. You can navigate through the pages in the report by either clicking on the pages listed below, or by using the keyword search tool below to find specific information within the annual report.-
 1
1 -
2
-
3
-
4
-
5
-
6
-
7
-
8
-
9
-
10
-
11
-
12
-
13
-
14
-
15
-
16
-
17
-
18
-
19
-
20
-
21
-
22
-
23
-
24
-
25
-
26
-
27
-
28
-
29
-
30
-
31
-
32
-
33
-
34
-
35
-
36
-
37
-
38
-
39
-
40
-
41
-
42
-
43
-
44
-
45
-
46
-
47
-
48
-
49
-
50
-
51
-
52
-
53
-
54
-
55
-
56
-
57
-
58
-
59
-
60
-
61
-
62
-
63
-
64
-
65
-
66
-
67
-
68
-
69
-
70
-
71
-
72
-
73
-
74
-
75
-
76
-
77
-
78
-
79
-
80
-
81
-
82
-
83
-
 84
84 -
 85
85 -
 86
86 -
 87
87 -
 88
88 -
 89
89 -
 90
90 -
 91
91 -
 92
92 -
 93
93 -
 94
94 -
 95
95 -
 96
96 -
 97
97 -
 98
98 -
 99
99 -
 100
100 -
 101
101 -
 102
102 -
 103
103 -
 104
104 -
105
-
106
-
107
-
108
-
109
-
110
-
111
-
112
-
113
-
114
-
115
-
116
-
117
-
118
-
119
-
120
-
121
-
122
-
123
-
124
-
125
-
126
-
127
-
128
-
129
-
130
-
131
-
132
-
133
-
134
-
135
-
136
-
137
-
138
-
139
-
140
-
141
-
142
-
143
-
144
-
145
-
146
-
147
-
148
-
149
-
150
-
151
-
152
-
153
-
154
-
155
-
156
-
157
-
158
-
159
-
160
-
161
-
162
-
163
-
164
-
165
-
166
-
167
-
168
-
169
-
170
-
171
-
172
-
173
-
174
-
175
-
176
-
177
-
178
-
179
-
180
 |
 |

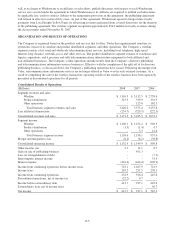
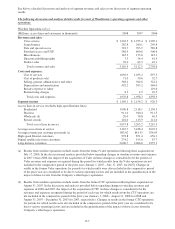
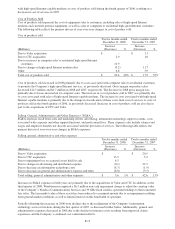
The following discussion and analysis details results for Windstream Consolidated Revenues.
The following table reflects the primary drivers of year-over-year changes in consolidated revenues and sales:
Consolidated revenues and sales
Twelve months ended
December 31, 2008
Twelve months ended
December 31, 2007
(Millions)
Increase
(Decrease) %
Increase
(Decrease) %
Due to changes in wireline segment revenues and sales $ (1.6) $ 353.9
Due to changes in product distribution segment revenues and sales (24.6) 5.0
Due to decreases in revenues and sales from other operations (123.0) (39.3)
Due to changes in affiliated eliminations 74.8 (107.0)
Total consolidated revenues and sales $ (74.4) (2)% $ 212.6 (7)%
Consolidated revenues and sales decreased $74.4 million, or 2 percent in 2008, and increased $212.6 million, or 7
percent, in 2007. The decrease in 2008 is primarily due to the sale of the Company’s directory publishing business in
the fourth quarter of 2007, as discussed above, and declines associated with continued access line losses, partially
offset by increases in high-speed Internet customers and the acquisition of CTC. The increase in consolidated revenues
and sales in 2007 is primarily due to the acquisitions of Valor and CTC, as well as to increases in high-speed Internet
customers, partially offset by declines in revenues associated with continued access line losses.
The decline in product distribution revenues and sales in 2008 is primarily due to lower affiliate sales and changes in
capital expenditures in the Company’s wireline operations, which had a corresponding impact on affiliate eliminations.
Also impacting eliminations of affiliate revenues and sales was the sale of directory publishing and resulting reduction
of publishing rights revenues. In 2007 the change in affiliate eliminations was primarily due to the discontinued
application of Statement of Financial Accounting Standards (“SFAS”) No. 71, “Accounting for the Effects of Certain
Types of Regulation” during the third quarter of 2006 (see Note 2). Previously, certain affiliated revenues earned and
expenses incurred by the Company’s regulated subsidiaries were not eliminated because they were priced in
accordance with Federal Communications Commission guidelines and were recovered through the regulatory process.
F-6