Windstream 2008 Annual Report Download - page 107
Download and view the complete annual report
Please find page 107 of the 2008 Windstream annual report below. You can navigate through the pages in the report by either clicking on the pages listed below, or by using the keyword search tool below to find specific information within the annual report.-
 1
1 -
2
-
3
-
4
-
5
-
6
-
7
-
8
-
9
-
10
-
11
-
12
-
13
-
14
-
15
-
16
-
17
-
18
-
19
-
20
-
21
-
22
-
23
-
24
-
25
-
26
-
27
-
28
-
29
-
30
-
31
-
32
-
33
-
34
-
35
-
36
-
37
-
38
-
39
-
40
-
41
-
42
-
43
-
44
-
45
-
46
-
47
-
48
-
49
-
50
-
51
-
52
-
53
-
54
-
55
-
56
-
57
-
58
-
59
-
60
-
61
-
62
-
63
-
64
-
65
-
66
-
67
-
68
-
69
-
70
-
71
-
72
-
73
-
74
-
75
-
76
-
77
-
78
-
79
-
80
-
81
-
82
-
83
-
84
-
85
-
86
-
87
-
88
-
89
-
90
-
91
-
92
-
93
-
94
-
95
-
96
-
 97
97 -
 98
98 -
 99
99 -
 100
100 -
 101
101 -
 102
102 -
 103
103 -
 104
104 -
 105
105 -
 106
106 -
 107
107 -
 108
108 -
 109
109 -
 110
110 -
 111
111 -
 112
112 -
 113
113 -
 114
114 -
 115
115 -
 116
116 -
 117
117 -
118
-
119
-
120
-
121
-
122
-
123
-
124
-
125
-
126
-
127
-
128
-
129
-
130
-
131
-
132
-
133
-
134
-
135
-
136
-
137
-
138
-
139
-
140
-
141
-
142
-
143
-
144
-
145
-
146
-
147
-
148
-
149
-
150
-
151
-
152
-
153
-
154
-
155
-
156
-
157
-
158
-
159
-
160
-
161
-
162
-
163
-
164
-
165
-
166
-
167
-
168
-
169
-
170
-
171
-
172
-
173
-
174
-
175
-
176
-
177
-
178
-
179
-
180
 |
 |

and conversion costs. These costs are considered indirect or general and are expensed when incurred in accordance
with SFAS No. 141 “Business Combinations”. During the second quarter of 2008, the Company determined not to use
certain software acquired in the CTC acquisition; therefore, we recognized a $5.4 million non-cash charge to abandon
this asset, of which $0.8 million was related to the wireless business.
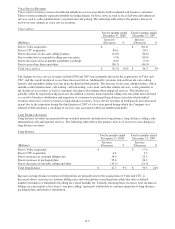
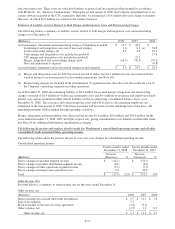
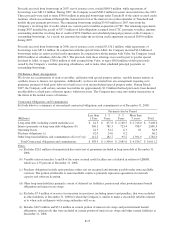
Summary of Liability Activity Related to Both Merger and Integration Costs and Restructuring Charges
The following table is a summary of liability activity related to both merger and integration costs and restructuring
charges as of December 31:
(Millions) 2008 2007 2006
Accrued merger, integration and restructuring charges at beginning of period $ 14.7 $ 28.9 $ -
Total merger and integration costs net of non-cash charges 1.6 8.2 (a) 38.8
Total restructuring charges (b) 8.5 4.6 10.6
Valor merger and integration costs included in goodwill - - 17.8
CTC merger and integration costs included in goodwill - 25.3 -
Merger, integration and restructuring charges paid (16.5) (52.3) (37.5)
Non cash adjustment to expense - - (0.8)
Accrued merger, integration and restructuring charges at end of period $ 8.3 $ 14.7 $ 28.9
(a) Merger and integration costs for 2007 have been revised to reflect that $1.1 million in costs associated with the
wireless business are now presented as discontinued operations (see Note 10).
(b) Restructuring charges are included in the determination of segment income. See above for the results for each of
the Company’s operating segments and other operations.
As of December 31, 2008, the remaining liability of $8.3 million for accrued merger, integration and restructuring
charges consisted of $1.9 million of Valor lease termination costs and $6.4 million of severance and employee-related
benefit costs and are included in other current liabilities in the accompanying consolidated balance sheets as of
December 31, 2008. The severance and related employee costs and will be paid as the remaining employees are
terminated in the first quarter of 2009. Valor lease payments will be made over the remaining term of the lease. All
remaining payments will be funded through operating cash flows.
Merger, integration and restructuring costs decreased net income $9.0 million, $8.8 million and $36.0 million for the
years ended December 31, 2008, 2007 and 2006, respectively, giving consideration to tax benefits on deductible items.
See Note 10 for additional information regarding these charges.
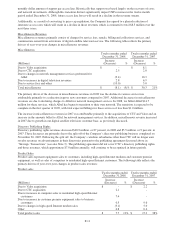
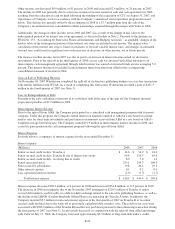
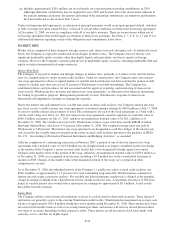
The following discussion and analysis details results for Windstream’s consolidated operating income and all other
consolidated results presented below operating income.
The following table reflects the primary drivers of year-over-year changes in consolidated operating income:
Consolidated operating income
Twelve months ended
December 31, 2008
Twelve months ended
December 31, 2007
(Millions)
Increase
(Decrease) %
Increase
(Decrease) %
Due to changes in wireline segment income $ (14.1) $ 233.9
Due to changes in product distribution segment income (0.1) (6.1)
Due to changes in other operations segment income (5.3) (7.3)
Due to changes in merger and acquisition costs 2.0 30.6
Total $ (17.5) (2)% $ 251.1 28%
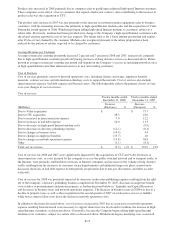
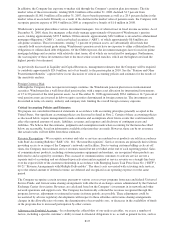
Other Income, Net
Set forth below is a summary of other income, net for the years ended December 31:
Other income, net
(Millions) 2008 2007 2006
Interest income on cash and short-term investments $ 2.7 $ 12.3 $ 7.8
Sale of investments 7.7 - -
Mark-to-market of interest rate swap agreement (5.8) (3.1) -
Other expense, net (2.5) 1.9 0.9
Other income, net $ 2.1 $ 11.1 $ 8.7
F-19