Windstream 2014 Annual Report Download - page 123
Download and view the complete annual report
Please find page 123 of the 2014 Windstream annual report below. You can navigate through the pages in the report by either clicking on the pages listed below, or by using the keyword search tool below to find specific information within the annual report.-
 1
1 -
2
-
3
-
4
-
5
-
6
-
7
-
8
-
9
-
10
-
11
-
12
-
13
-
14
-
15
-
16
-
17
-
18
-
19
-
20
-
21
-
22
-
23
-
24
-
25
-
26
-
27
-
28
-
29
-
30
-
31
-
32
-
33
-
34
-
35
-
36
-
37
-
38
-
39
-
40
-
41
-
42
-
43
-
44
-
45
-
46
-
47
-
48
-
49
-
50
-
51
-
52
-
53
-
54
-
55
-
56
-
57
-
58
-
59
-
60
-
61
-
62
-
63
-
64
-
65
-
66
-
67
-
68
-
69
-
70
-
71
-
72
-
73
-
74
-
75
-
76
-
77
-
78
-
79
-
80
-
81
-
82
-
83
-
84
-
85
-
86
-
87
-
88
-
89
-
90
-
91
-
92
-
93
-
94
-
95
-
96
-
97
-
98
-
99
-
100
-
101
-
102
-
103
-
104
-
105
-
106
-
107
-
108
-
109
-
110
-
111
-
112
-
 113
113 -
 114
114 -
 115
115 -
 116
116 -
 117
117 -
 118
118 -
 119
119 -
 120
120 -
 121
121 -
 122
122 -
 123
123 -
 124
124 -
 125
125 -
 126
126 -
 127
127 -
 128
128 -
 129
129 -
 130
130 -
 131
131 -
 132
132 -
 133
133 -
134
-
135
-
136
-
137
-
138
-
139
-
140
-
141
-
142
-
143
-
144
-
145
-
146
-
147
-
148
-
149
-
150
-
151
-
152
-
153
-
154
-
155
-
156
-
157
-
158
-
159
-
160
-
161
-
162
-
163
-
164
-
165
-
166
-
167
-
168
-
169
-
170
-
171
-
172
-
173
-
174
-
175
-
176
-
177
-
178
-
179
-
180
-
181
-
182
-
183
-
184
-
185
-
186
-
187
-
188
-
189
-
190
-
191
-
192
-
193
-
194
-
195
-
196
-
197
-
198
-
199
-
200
-
201
-
202
-
203
-
204
-
205
-
206
-
207
-
208
-
209
-
210
-
211
-
212
-
213
-
214
-
215
-
216
 |
 |

F-7
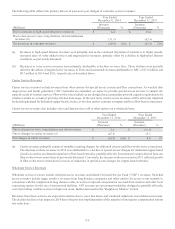
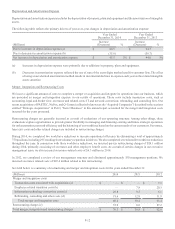
The following table reflects the primary drivers of year-over-year changes in enterprise and small business service revenues:
Year Ended
December 31, 2014
Year Ended
December 31, 2013
(Millions)
Increase
(Decrease) %
Increase
(Decrease) %
Due to increases in data and integrated services and high-speed
Internet revenues (a) $ 36.4 $ 76.3
Due to increases in data center and managed service revenues
(b) 21.2 11.8
Due to decreases in voice, long distance and miscellaneous
revenues (c) (63.3) (51.0)
Net changes in enterprise and small business revenues $(5.7) — % $ 37.1 1%
(a) Increases in data and integrated services revenues were primarily due to continued demand for advanced data services and
customer migration to our integrated voice and data services, previously discussed.
(b) Increases in data center and managed services revenues; which include cloud computing, colocation, dedicated server and
disaster recovery solutions for business customers; reflected increased demand and incremental sales of these services. In
order to support the higher demand, we have added four data centers since the first quarter of 2013.
(c) Decreases in traditional voice and long-distance service revenues were primarily attributable to lower usage, adverse effects
of competition and migration of existing customers to integrated services and bundled offerings. These declines were
partially offset by incremental revenues attributable to the access recovery charge (“ARC”) of $18.8 million and $23.1
million in 2014 and 2013, respectively, primarily due to an increase in the monthly rate effective July 1st of each year. The
ARC is a monthly charge established by the FCC designed to mitigate revenue reductions from intercarrier compensation
reform.
Consumer Service Revenues
Consumer service revenues are generated from the provision of high-speed Internet, voice and video services to consumers. We
expect the trend of consumer voice line loss to continue as a result of competition from wireless carriers, cable companies and
other providers using emerging technologies. For the year ended December 31, 2014, consumer voice lines decreased by
approximately 107,700, or 6.3 percent compared to 119,600, or 6.5 percent during 2013. Demand for faster broadband speeds and
Internet-related services, such as virus protection and online data backup services, are expected to favorably impact consumer
high-speed Internet revenues, offsetting some of the decline in consumer voice revenues.
For the years ended December 31, 2014 and 2013, consumer high-speed Internet customers decreased by approximately 39,300,
or 3.4 percent, and 43,600, or 3.6 percent, respectively. As of December 31, 2014, we provided high-speed Internet service to
approximately 74 percent of primary residential lines in service and approximately 77 percent of our total voice lines had high-
speed Internet competition, primarily from cable service providers. We do not expect significant additional cable expansions into
our service areas during 2015, but we could experience some increased competition from high-speed Internet offerings of wireless
competitors. The number of high-speed Internet customers we serve will continue to be impacted by the effects of competition
from other service providers and increased penetration in the marketplace as the number of households without high-speed Internet
service continues to shrink.
To combat competitive pressures in our markets, we emphasize our bundled service strategy and enhancements to our network to
offer faster Internet speeds. Service bundles provide discounts and other incentives for customers to bundle their voice, long
distance, high-speed Internet and video services and have positively impacted our operating trends.