Windstream 2014 Annual Report Download - page 125
Download and view the complete annual report
Please find page 125 of the 2014 Windstream annual report below. You can navigate through the pages in the report by either clicking on the pages listed below, or by using the keyword search tool below to find specific information within the annual report.-
 1
1 -
2
-
3
-
4
-
5
-
6
-
7
-
8
-
9
-
10
-
11
-
12
-
13
-
14
-
15
-
16
-
17
-
18
-
19
-
20
-
21
-
22
-
23
-
24
-
25
-
26
-
27
-
28
-
29
-
30
-
31
-
32
-
33
-
34
-
35
-
36
-
37
-
38
-
39
-
40
-
41
-
42
-
43
-
44
-
45
-
46
-
47
-
48
-
49
-
50
-
51
-
52
-
53
-
54
-
55
-
56
-
57
-
58
-
59
-
60
-
61
-
62
-
63
-
64
-
65
-
66
-
67
-
68
-
69
-
70
-
71
-
72
-
73
-
74
-
75
-
76
-
77
-
78
-
79
-
80
-
81
-
82
-
83
-
84
-
85
-
86
-
87
-
88
-
89
-
90
-
91
-
92
-
93
-
94
-
95
-
96
-
97
-
98
-
99
-
100
-
101
-
102
-
103
-
104
-
105
-
106
-
107
-
108
-
109
-
110
-
111
-
112
-
113
-
114
-
 115
115 -
 116
116 -
 117
117 -
 118
118 -
 119
119 -
 120
120 -
 121
121 -
 122
122 -
 123
123 -
 124
124 -
 125
125 -
 126
126 -
 127
127 -
 128
128 -
 129
129 -
 130
130 -
 131
131 -
 132
132 -
 133
133 -
 134
134 -
 135
135 -
136
-
137
-
138
-
139
-
140
-
141
-
142
-
143
-
144
-
145
-
146
-
147
-
148
-
149
-
150
-
151
-
152
-
153
-
154
-
155
-
156
-
157
-
158
-
159
-
160
-
161
-
162
-
163
-
164
-
165
-
166
-
167
-
168
-
169
-
170
-
171
-
172
-
173
-
174
-
175
-
176
-
177
-
178
-
179
-
180
-
181
-
182
-
183
-
184
-
185
-
186
-
187
-
188
-
189
-
190
-
191
-
192
-
193
-
194
-
195
-
196
-
197
-
198
-
199
-
200
-
201
-
202
-
203
-
204
-
205
-
206
-
207
-
208
-
209
-
210
-
211
-
212
-
213
-
214
-
215
-
216
 |
 |

F-9
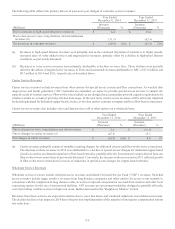
The following table reflects the primary drivers of year-over-year changes in wholesale service revenues:
Year Ended
December 31, 2014
Year Ended
December 31, 2013
(Millions)
Increase
(Decrease) %
Increase
(Decrease) %
Due to decreases in state USF revenues (2.5)(9.0)
Due to changes in federal USF revenues (a) (3.6) 32.9
Due to decreases in switched access revenues (b) (44.3) (127.2)
Net decreases in wholesale revenues $ (50.4) (10)% $ (103.3)(18)%
(a) Federal USF revenues primarily consists of revenues attributable to the access recovery mechanism (“ARM”) and frozen
USF support. The ARM, which was implemented during late 2012, is additional federal universal service support available
to help mitigate revenue losses from intercarrier compensation reform not covered by the ARC, previously discussed.
The decline in 2014 is mostly attributable to a decrease in the ARM monthly rate effective July 1, 2014. Conversely,
ARM-related revenues grew in 2013 due to an increase in the monthly rate effective July 1, 2013.
(b) Decreases in switched access revenues were primarily due to the impact of intercarrier compensation reform and a
continued decline in network demand. As previously discussed, the ARC and ARM are designed to help mitigate the
revenue losses resulting from intercarrier compensation reform.
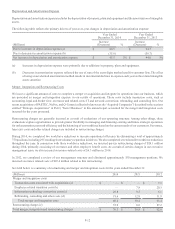
Other Service Revenues
Other service revenues include USF surcharge revenues, revenues from other miscellaneous services and consumer revenues
generated in markets where we lease the connection to the customer premise. We no longer offer new consumer service in those
areas, and as a result, consumer revenues have declined as existing customers disconnect their service. As previously discussed,
we expect to transfer substantially all of this consumer business to the REIT in connection with the proposed spin-off of certain
network and real estate assets. Other service revenues decreased $2.0 million, or 1 percent, and $27.3 million, or 11 percent in the
years ended December 31, 2014 and 2013, respectively.
Product Sales
Product sales consist of sales of various types of communications equipment to our customers. Business product sales includes
high-end data and communications equipment which facilitate the delivery of advanced data and voice services to our business
customers. Consumer product sales include high-speed Internet modems, home networking equipment, computers and phones.
We also sell network equipment to contractors on a wholesale basis.
The following table reflects the primary drivers of year-over-year changes in product sales:
Year Ended
December 31, 2014
Year Ended
December 31, 2013
(Millions)
Increase
(Decrease) %
Increase
(Decrease) %
Due to increases in consumer product sales $1.5$2.5
Due to decreases in contractor sales (13.1)(13.0)
Due to decreases in business product sales (19.1)(8.1)
Net decreases in product sales $ (30.7) (14)% $ (18.6)(8)%